Brain-fingerprinting
Author: Jason da Silva Castanheira
This tutorial introduces the concept and method of neurophysiological brain-fingerprinting. Using the outputs of the OMEGA tutorial, we will derrive spectral brain-fingerprints, as detailed below, for the five example participants.
Contents
Introduction
Brain-fingerprinting is a method to assess inter-individual differences in brain activity. It was first proposed by Finn and colleagues in 2015. The present tutorial will demonstrate the method's functionality using Brainstorm outputs.
This demonstration uses sample data from the OMEGA dataset , and can be followed by completing all steps of the OMEGA tutorial.
Preparing the data for brain-fingerprinting
The brain-fingerprinting method requires features of interest to define the so-called brain-fingerprint. These features can be derrived from functional connectomes or from neural power spectrum, as detailed in da Silva Castanheira et al., 2021.
This tutorial will focus on derriving brain-fingerprints using neural power spectra at every parcel of the Destrieux atlas.
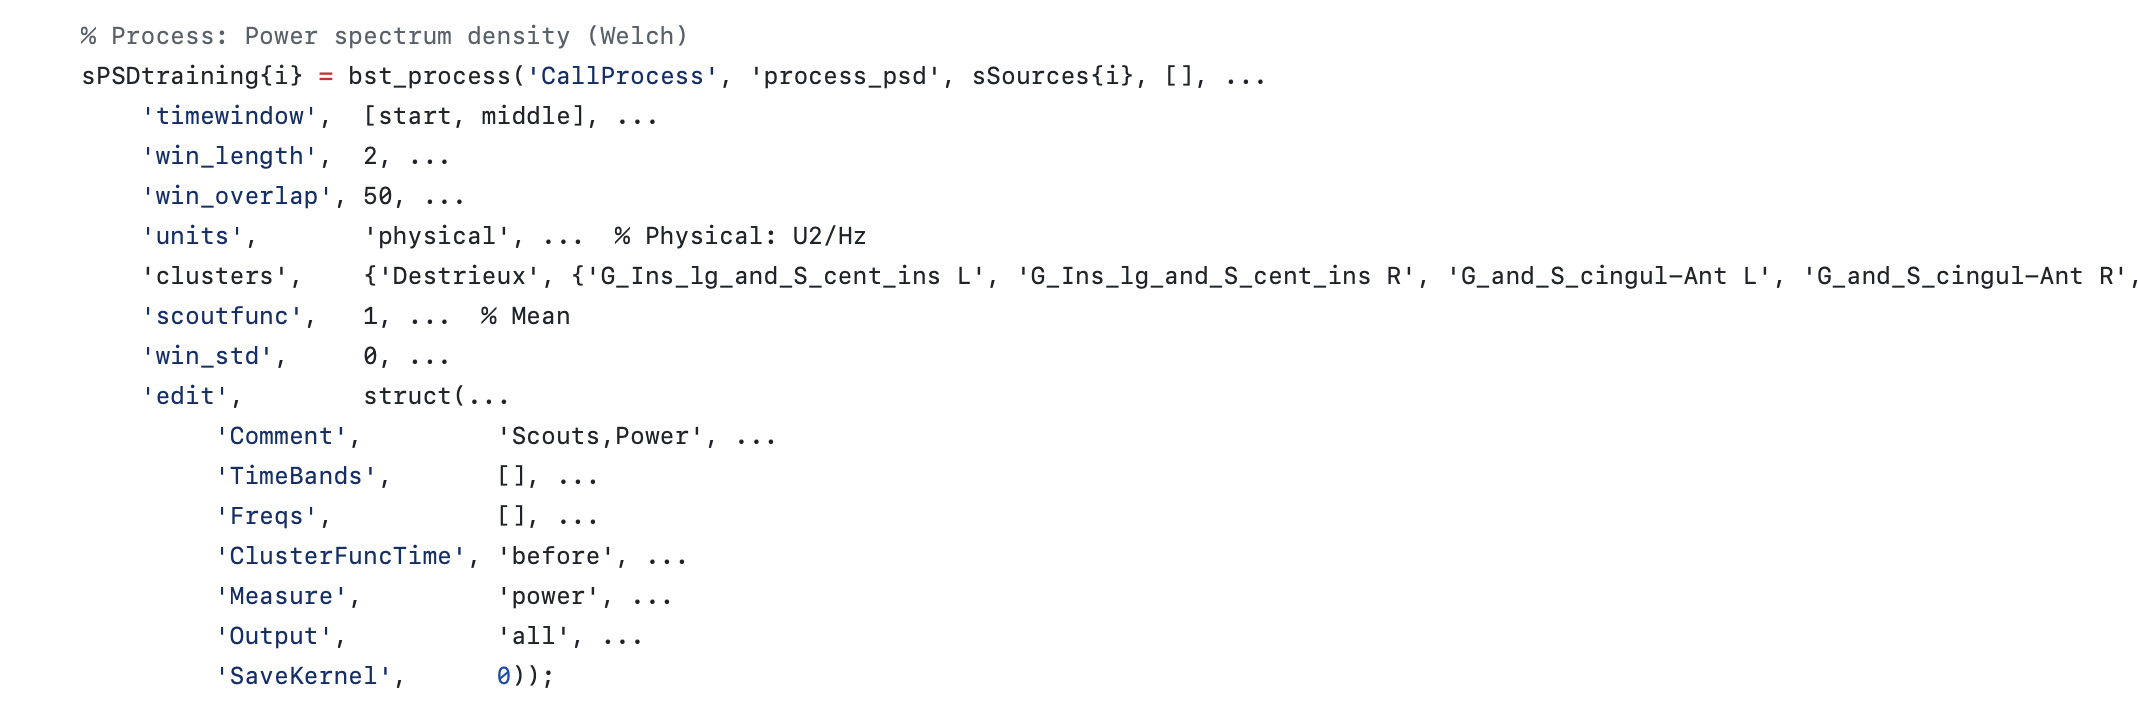
To do so, we compute the spectrum (i.e., PSD) using the Welch method at every vertex of the cortical surface, and average the resulting values within each region defined by the Destrieux atlas. Note, this is done to downsample the spatial features of the brain-fingerprint. If we did not downsample the PSD to a cortical atlas, the resulting feature space would be too large to work with (e.g., 15,000 vertecies by 300 frequncies).
See code snippet below:

Brain-fingerprinting require at least two data segments for every individual. For the purposes of this demonstartion, we will split the OMEGA recordings in half (i.e., within-session fingerprinting).
See image below for a summary of the pipeline.

The brain-fingerpinting method
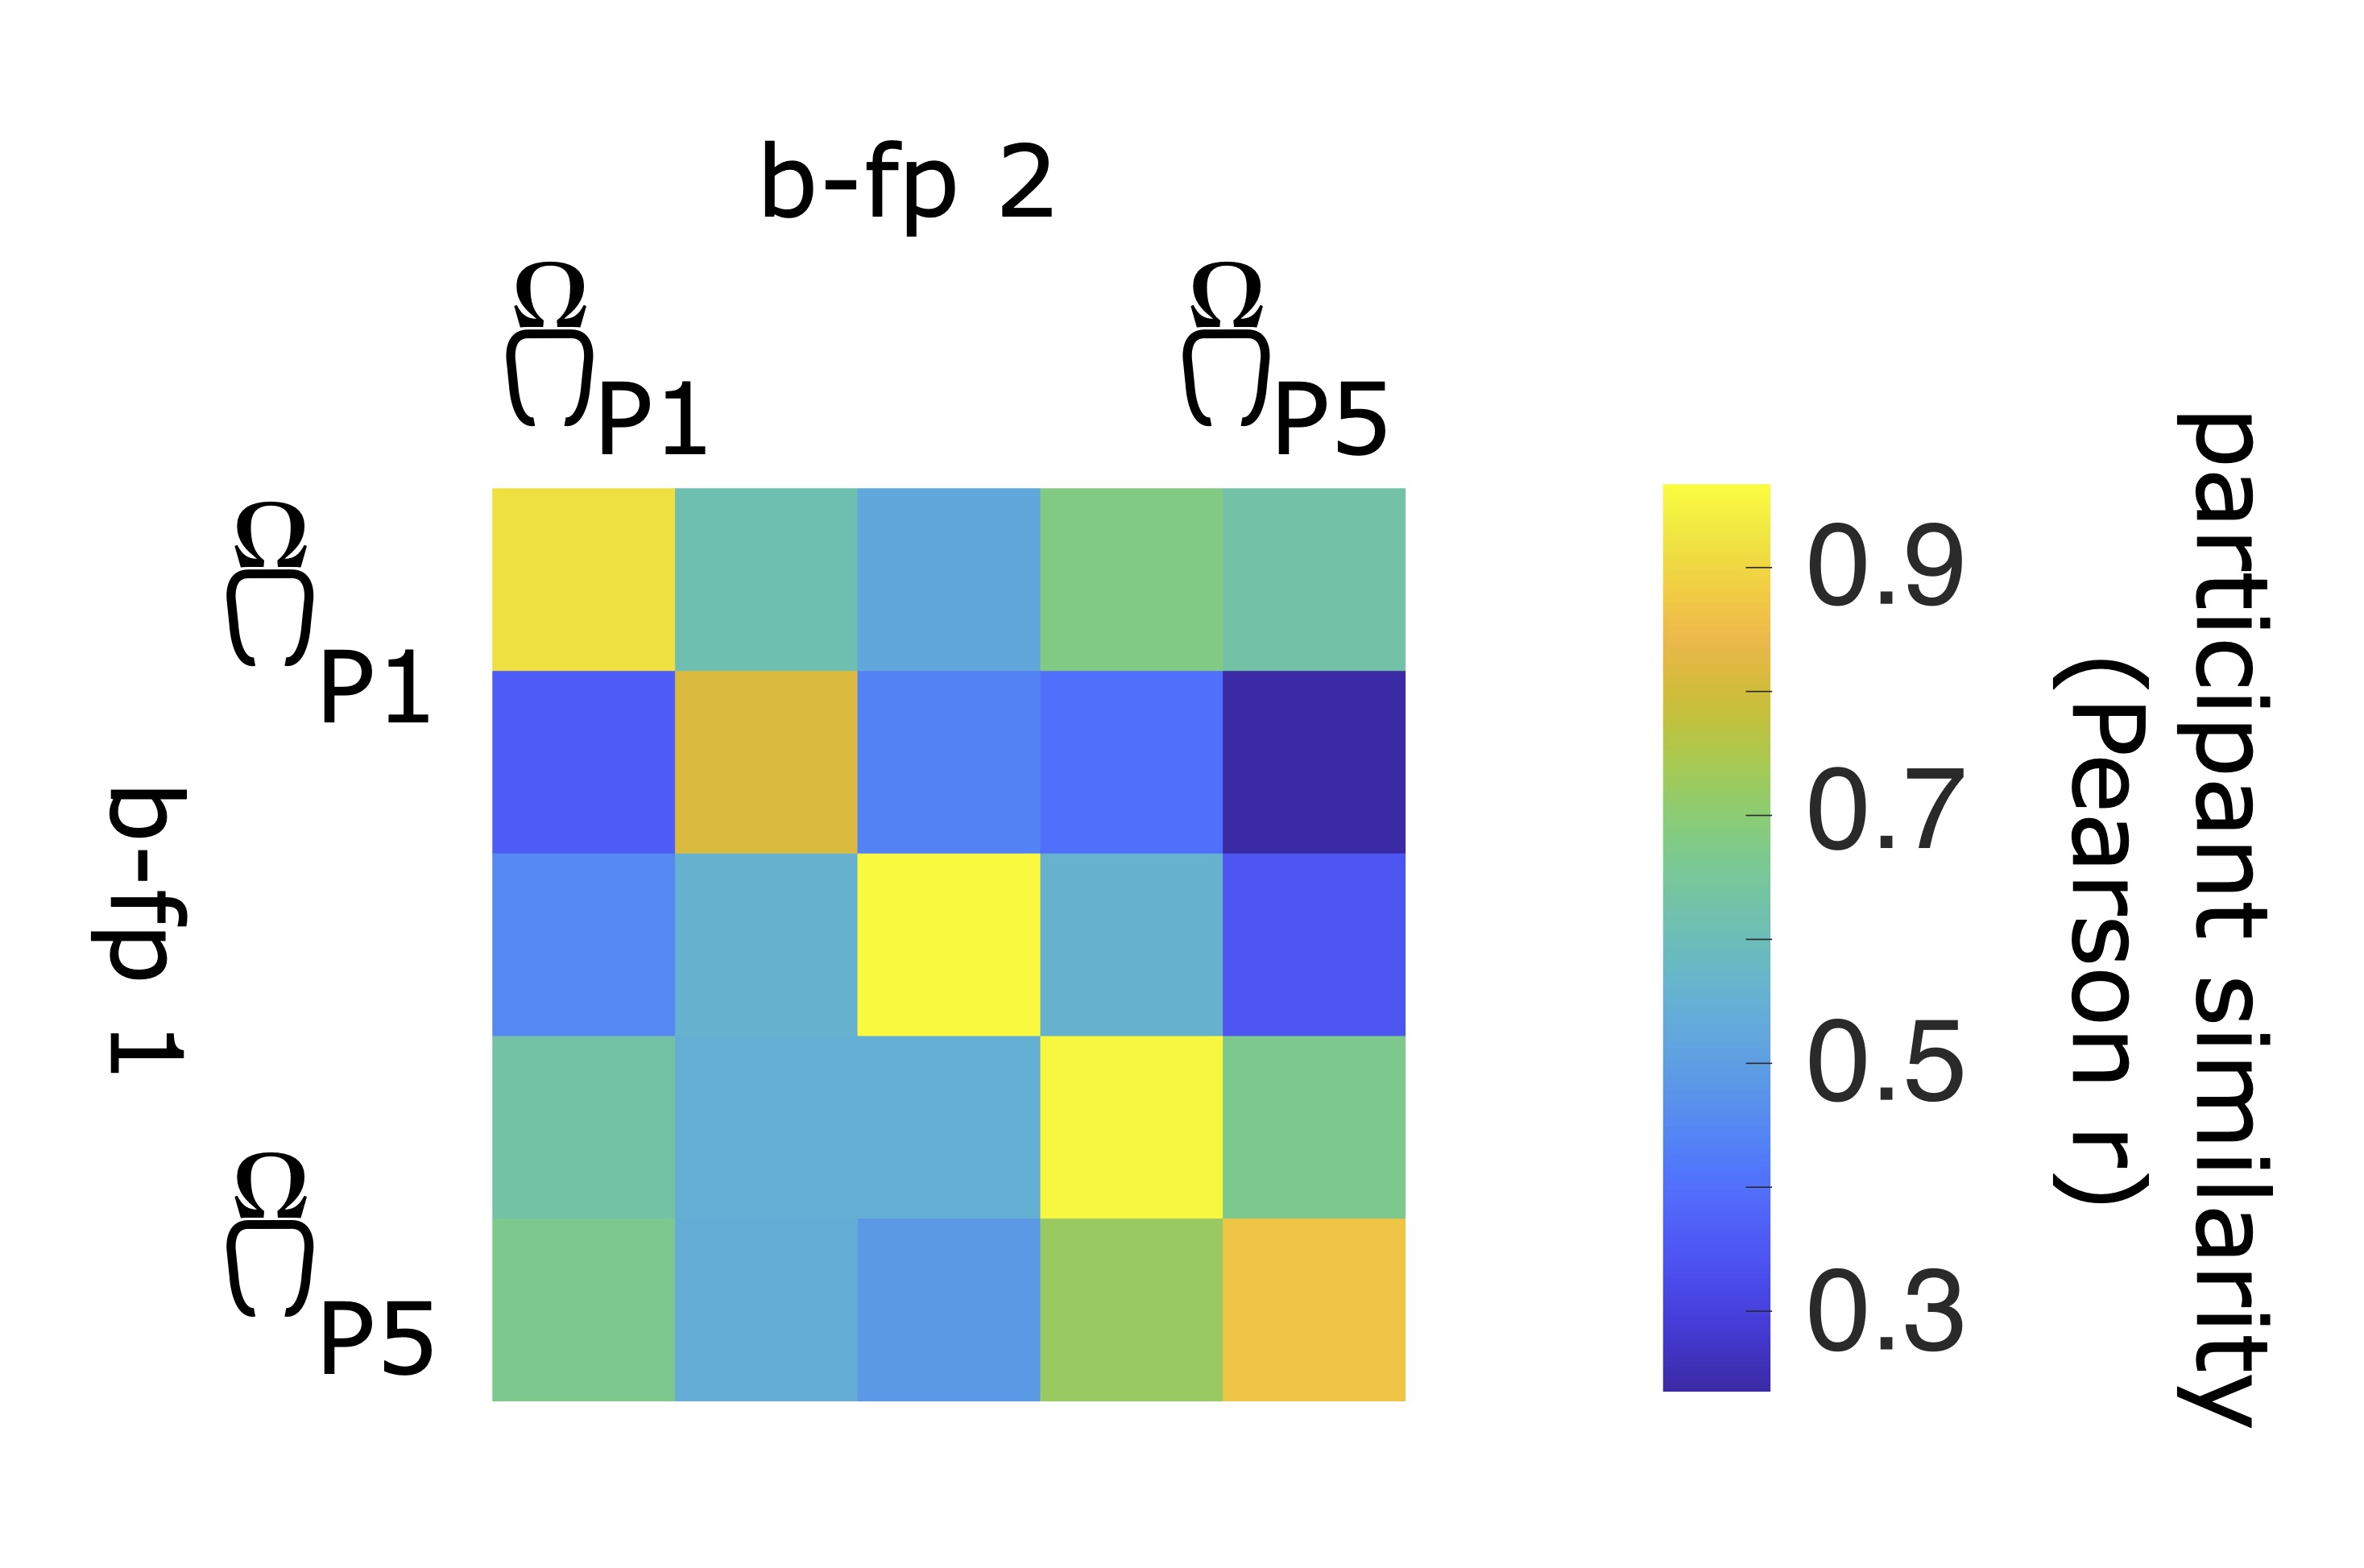
Brain-fingerprinting is a method based on the correlational similarity of participants across data segments. For each participant in a given cohort, we compute the Pearson correlation coefficient between the brain-fingerprint (in the case of this demonstration, the regional PSD) of the first segment and the second brain-fingerprint of all participants in the cohort, including the probe participant. This yeilds a participant similarity matrix, where off-diagonal elements represent the similarity of a participant i to all other participant and diagonal elements represent the similarity of a participant's brain-fingerprint across data segments.
 Participant differentiation consists of a lookup procedure along the rows or columns of the participant similarity correlation matrix. A participant is said to be correctly differentiated if a participant's brain-fingerprint is most similar to themselves (self-similarity) than all other participants in the cohort (other-similarity). In other words, if the largest correlation coefficient between the first brain-fingerprint and the second matches the probe participant.
Differentiation accuracy
Differentiation accuracy represent the percent ratio of the number of participants correctly differentiated across the cohort (i.e., differentiation accuracy). Brain-fingerprinting is typically repreated for all possible pairs of data segments. In the case of this tutorial, we only have two data segments (the first and second half of the recording) and therefore only have two differentiation accuracies--obtained by a lookup procedure along the rows and columns respectively.
Differentiability
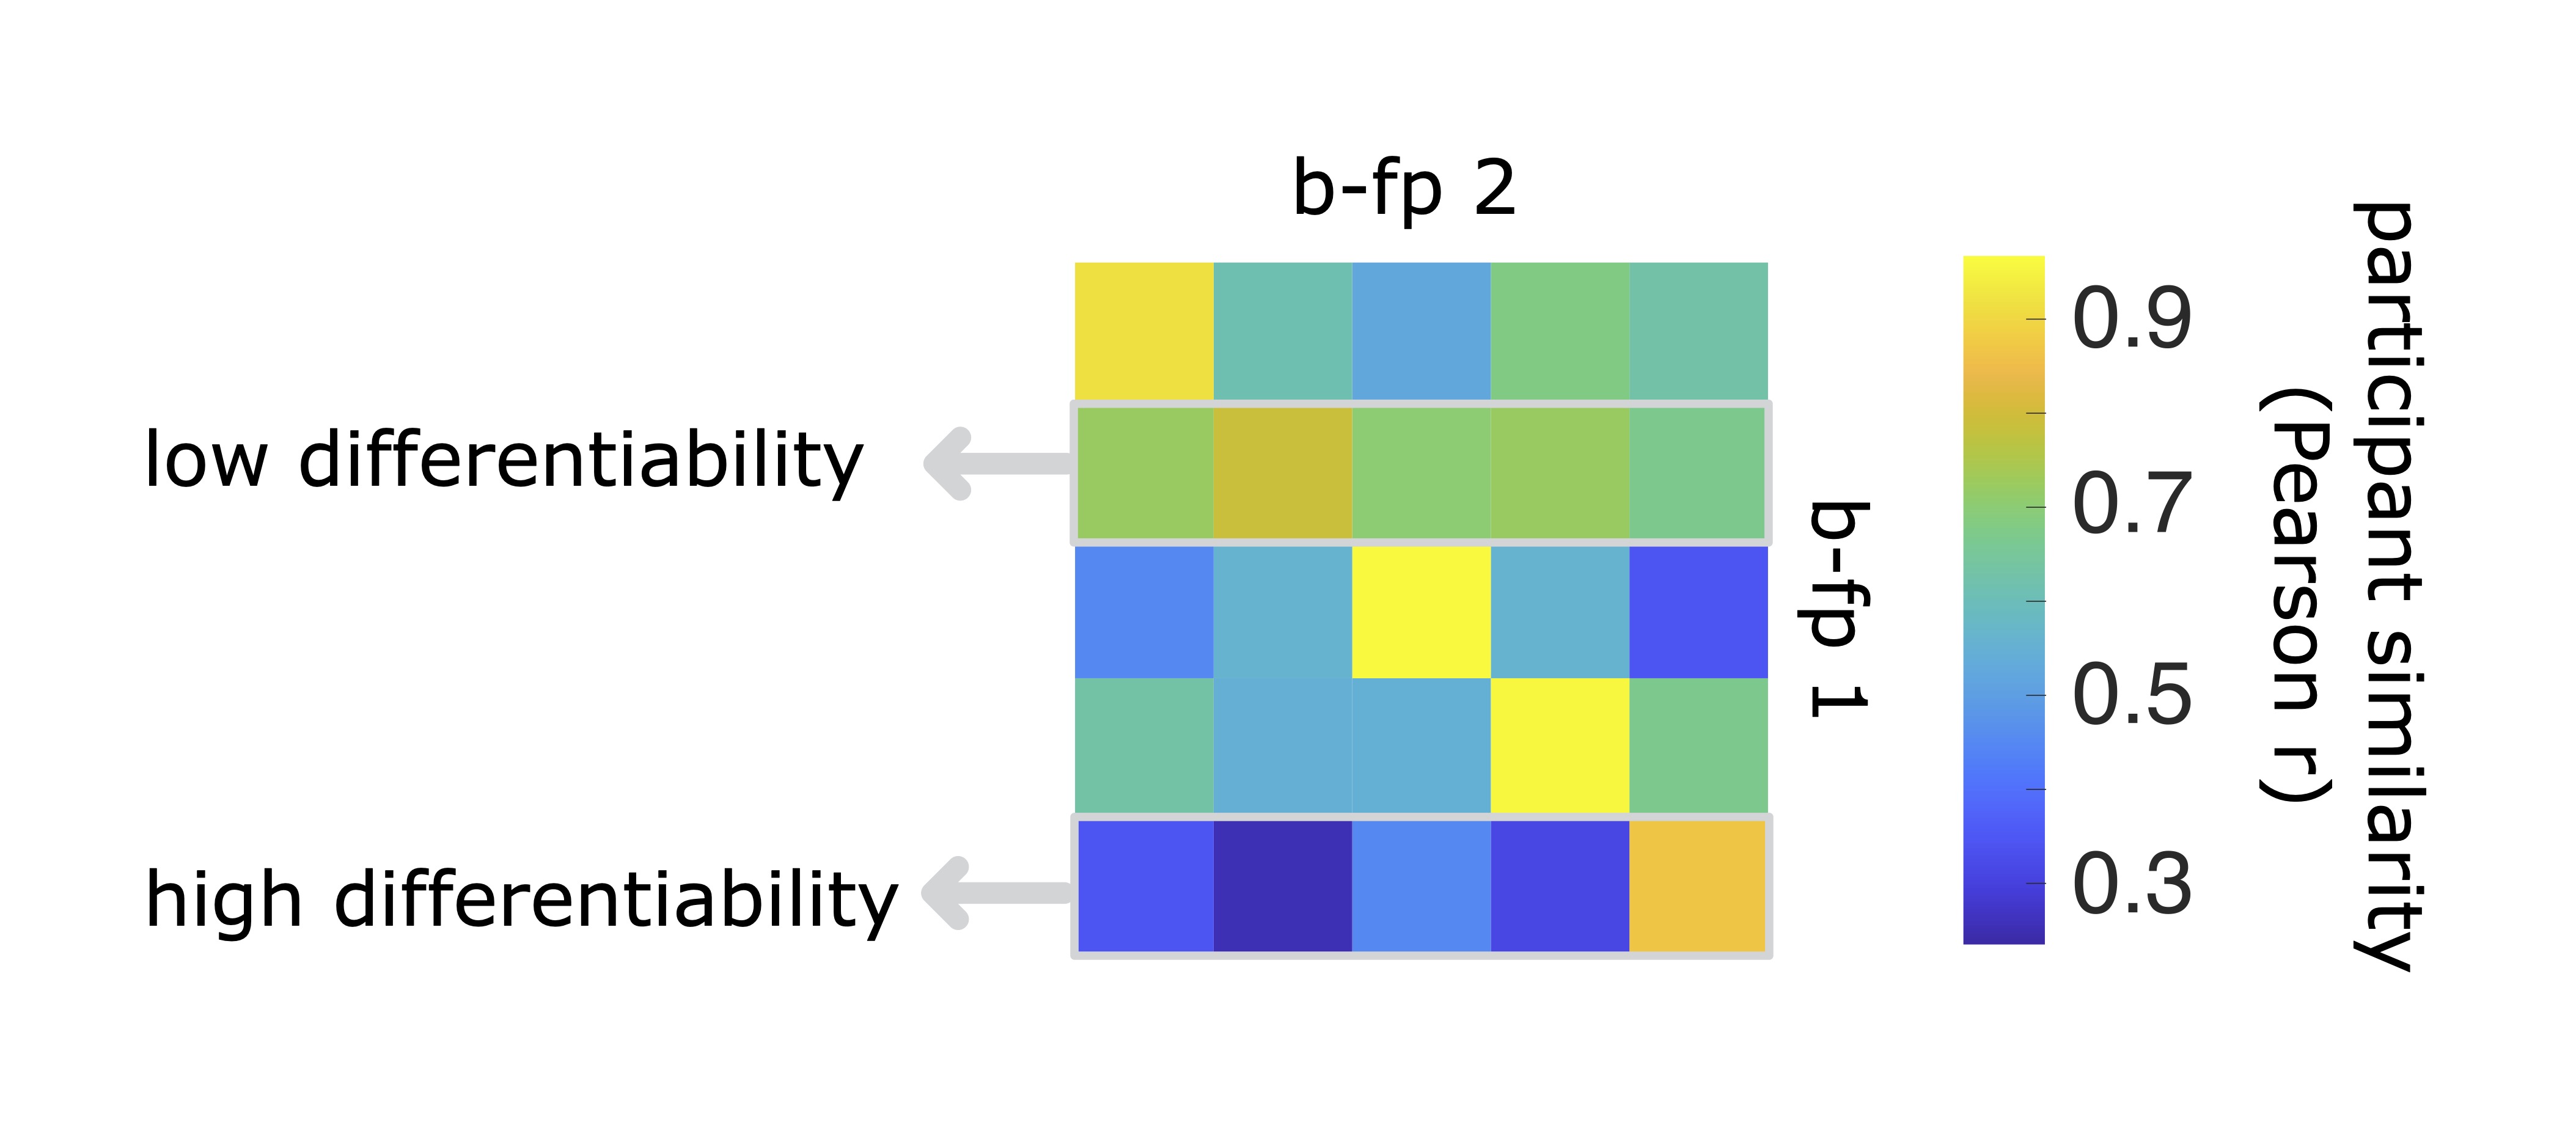
We previously defined differentiability to describe how easy any given participant is to differentiate from a cohort of individuals. This measure consists of z-scoring the self-similarity of brain-fingerprtints agaisnt the other-similarity (off-diagonal elements). A participant with a high differentiability score will have a much higher self-similarity relative to their similarity to others in the cohort (other-similarity) and thereofre are easily differentiated. In contrast, a participant whose brain-fingerprint is most similar to others in the cohort will be more challenging to differentiate. See image below for a visual explination of the effect.

Quantifying the most salient features of the brain-fingerprint
Beyond differentiation accuracy and differentiability, we can quantify the relative contribution of regions and frequncies to participant differentiaon.
To do so, we calculated intraclass correlations (ICC). ICC quantifies the ratio of within-participant variance and between-participant variance, with participants as their own raters across data segments. Features that contribute the most to participant differentiation should be highly consistnet within individuals, but show great inter-individual variance. High values of ICC indicate that a neurophysiological feature (e.g., region of interest or frequnecy band) corresponds contribute the most to participant differentiation.
The following code snippet computes ICC for every freuqncy band and region of the brain-fingerprint:
INSERT IMAGE
Applications of the brain-fingerprint
Beyond biometric differentiation, brain-fingerprints inform clinical practice and advance the neurobiological origins of individual traits. Below we summaizre some of the most recent applications of brain-fingerprints.
Decoding individual traits: Previous work demonstrates that beyond biometric identification, brain-fingerprints can predict individual differences in intelligence test perforamnce (e.g., Finn et al., 2015; Amico et al., 2018) and demographics (da Silva Castanheira et al., 2021).
Clinical application: Recent work has explored the clinical utility of bran-fingerprints. This work has shown acorss multiple neuroplogical diseases that the brain-fingerpritns of patients show increased variability (lower self-similairty/ Iself ) in brain-fingerprints of clinical populations (e.g., Kaufmann et al., 2017b, 2018b; Sorrentino et al., 2021b; Troisi Lopez et al., 2023; da Silva Castanheira et al., 2024). A potential explanation for the de-individualization of brain activity in observed in Parkinson’s disease may be an inherent instability in the arrythmic brain activity of patients over short periods of time. In contrast, rythmic brain activity appears particulalry characersitic of patients with PD (da Silva Castanheira et al., 2024). Future work is exploring the application of brain-fingerprints to the design of personalized medicine.
Additional documentation
Please cite previous work on brain-fingerprinting:
Further reading:
