|
Size: 16932
Comment:
|
Size: 15440
Comment:
|
| Deletions are marked like this. | Additions are marked like this. |
| Line 4: | Line 4: |
| The anatomy of your subject is ready. Before we can start looking at the MEG/EEG recordings, we need to make sure that the sensors (electrodes, magnetometers or gradiometers) are properly aligned with the MRI and the surfaces of the subject. In this tutorial, we will start with a detailed description of the experiment and the files that were recorded, then we will link the original CTF files to the database in order to get access to the sensors positions, and finally we will explore the various options for aligning these sensors on the head of the subject. |
|
| Line 6: | Line 10: |
| = From Auditory = | <<Include(DatasetIntroduction, , from="\<\<HTML\(\<!-- START-PAGE --\>\)\>\>", to="\<\<HTML\(\<!-- STOP-NO-ANAT --\>\)\>\>")>> |
| Line 8: | Line 12: |
| == Link the recordings == * Switch to the "functional data" view. |
== Link the raw files to the database == * Switch to the "functional data" view. <<BR>><<BR>> {{attachment:view_functional.gif}} |
| Line 12: | Line 16: |
| * Select all the .ds folders in: '''sample_auditory/data''' {{http://neuroimage.usc.edu/brainstorm/Tutorials/Auditory?action=AttachFile&do=get&target=raw1.gif|raw1.gif|height="156",width="423",class="attachment"}} * Refine registration now? '''YES''' . {{http://neuroimage.usc.edu/brainstorm/Tutorials/Auditory?action=AttachFile&do=get&target=raw2.gif|raw2.gif|height="224",width="353",class="attachment"}} |
* Select __'''all'''__ the .ds folders in: '''sample_introduction/data''' |
| Line 16: | Line 18: |
| == Multiple runs and head position == * The two AEF runs 01 and 02 were acquired successively, the position of the subject's head in the MEG helmet was estimated twice, once at the beginning of each run. The subject might have moved between the two runs. To evaluate visually the displacement between the two runs, select at the same time all the channel files you want to compare (the ones for run 01 and 02), right-click > Display sensors > MEG. . {{http://neuroimage.usc.edu/brainstorm/Tutorials/Auditory?action=AttachFile&do=get&target=raw3.gif|raw3.gif|height="220",width="441",class="attachment"}} * Typically, we would like to group the trials coming from multiple runs by experimental conditions. However, because of the subject's movements between runs, it's not possible to directly compare the sensor values between runs because they probably do not capture the brain activity coming from the same regions of the brain. * You have three options if you consider grouping information from multiple runs: * '''Method 1''': Process all the runs separately and average between runs at the source level: The more accurate option, but requires a lot more work, computation time and storage. * '''Method 2''': Ignore movements between runs: This can be acceptable for commodity if the displacements are really minimal, less accurate but much faster to process and easier to manipulate. * '''Method 3''': Co-register properly the runs using the process Standardize > Co-register MEG runs: Can be a good option for displacements under 2cm. Warning: This method has not be been fully evaluated on our side, to use at your own risk. * In this tutorial, we will illustrate only method 1: runs are not co-registered. |
* {{attachment:review_menu.gif||height="190",width="614"}} * Refine registration now? '''YES''' <<BR>><<BR>>{{attachment:review_refine.gif}} |
| Line 26: | Line 21: |
| == Epoched vs. continuous == * The CTF MEG system can save two types of files: epoched (.ds) or continuous (_AUX.ds). * Here we have an intermediate storage type: continuous recordings saved in an "epoched" file. The file is saved as small blocks of recordings of a constant time length (1 second in this case). All those time blocks are contiguous, there is no gap between them. * Brainstorm can consider this file either as a continuous or an epoched file. By default it imports the regular .ds folders as epoched, but we can change this manually, to process it as a continuous file. * Double-click on the "Link to raw file" for run 01 to view the MEG recordings. You can navigate in the file by blocks of 1s, and switch between blocks using the "Epoch" box in the Record tab. The events listed are relative to the current epoch. . {{http://neuroimage.usc.edu/brainstorm/Tutorials/Auditory?action=AttachFile&do=get&target=raw4.gif|raw4.gif|height="206",width="575",class="attachment"}} * Right-click on the "Link to raw file" for run 01 > '''Switch epoched/continuous''' * Double-click on the "Link to raw file" again. Now you can navigate in the file without interruptions. The box "Epoch" is disabled and all the events in the file are displayed at once. . {{http://neuroimage.usc.edu/brainstorm/Tutorials/Auditory?action=AttachFile&do=get&target=raw5.gif|raw5.gif|height="209",width="576",class="attachment"}} * Repeat this operation twice to convert all the files to a continuous mode. * '''Run 02''' > Switch epoched/continuous * '''Noise''' > Switch epoched/continuous |
== Registration with MRI == |
| Line 39: | Line 23: |
| = From continuous = == Access the raw file == The basic tutorials you read before explain how to import recordings in the database: this operation creates a copy of all the data in Matlab .mat files in the Brainstorm database folders. You could process continuous recordings in the same way, but the .mat format has this limitation that the entire file has to be read even when you want to access just a portion of it. Long recordings usually cannot fit in memory and have to be split in small blocks of a few seconds, which makes it very difficult to review and process. |
|
| Line 43: | Line 24: |
| Brainstorm offers the possibility to visualize continuous MEG/EEG recordings in any of the supported file formats without having to fully "import" them. A link to the native file is created in the database, which can be then manipulated almost like the "imported" recording blocks. Only the description of the file is saved in the database, and when displaying it the values are read directly from the native file. In addition, an interface allows to edit the time markers that are saved in the file. Those markers can then be used to import the recordings in the database (ie. to do the segmentation of the continuous recordings in epochs/trials). Then the imported epochs/trials (hard copies in .mat format) can be pre-processed and averaged. * Select the exploration mode: "Functional data (sorted by subject)"<<BR>><<BR>> {{attachment:view_functional.gif}} * Right-click on the subject node, and select: "Review raw file". Select the "MEG: CTF" file type, and pick the ds folder in "/sample_raw/Data". . {{http://neuroimage.usc.edu/brainstorm/Tutorials/TutRawViewer?action=AttachFile&do=get&target=menuReview.gif|menuReview.gif|class="attachment"}} * Then you're asked if you want to "Refine the registration with the head points". This operation improves the initial MRI/MEG registration by fitting the head points digitized before the MEG acquisition on the scalp surface with an ICP algorithm. Answer yes. Even if the result is not perfect, it usually improves the positioning of the head in the MEG helmet. The grey surface represents the head extracted from the MRI, the yellow surface represents the inside of the MEG helmet, and the green dots are the head shape points digitized with the Polhemus device; the goal is to align the green points on the grey surface. |
* <<BR>>This operation improves the initial MRI/MEG registration by fitting the head points digitized before the MEG acquisition on the scalp surface with an ICP algorithm. Answer yes. Even if the result is not perfect, it usually improves the positioning of the head in the MEG helmet. The grey surface represents the head extracted from the MRI, the yellow surface represents the inside of the MEG helmet, and the green dots are the head shape points digitized with the Polhemus device; the goal is to align the green points on the grey surface. |
| Line 56: | Line 30: |
Brainstorm offers the possibility to visualize continuous MEG/EEG recordings in any of the supported file formats without having to fully "import" them. A link to the native file is created in the database, which can be then manipulated almost like the "imported" recording blocks. Only the description of the file is saved in the database, and when displaying it the values are read directly from the native file. * A common source of confusion for beginners is the difference between the two menus that allow you to bring external data into the Brainstorm environment: * '''Review raw file''': Allows you to create a link to your original data file. It reads the header and sensor information from the file and saves it in the database as a = From auditory = == Link the recordings == * Switch to the "functional data" view. * Right-click on the subject folder > Review raw file * Select the file format: "'''MEG/EEG: CTF (*.ds...)'''" * Select all the .ds folders in: '''sample_introduction/data''' {{http://neuroimage.usc.edu/brainstorm/Tutorials/Auditory?action=AttachFile&do=get&target=raw1.gif|raw1.gif|height="156",width="423",class="attachment"}} * Refine registration now? '''YES''' . {{http://neuroimage.usc.edu/brainstorm/Tutorials/Auditory?action=AttachFile&do=get&target=raw2.gif|raw2.gif|height="224",width="353",class="attachment"}} == Multiple runs and head position == * The two AEF runs 01 and 02 were acquired successively, the position of the subject's head in the MEG helmet was estimated twice, once at the beginning of each run. The subject might have moved between the two runs. To evaluate visually the displacement between the two runs, select at the same time all the channel files you want to compare (the ones for run 01 and 02), right-click > Display sensors > MEG. . {{http://neuroimage.usc.edu/brainstorm/Tutorials/Auditory?action=AttachFile&do=get&target=raw3.gif|raw3.gif|height="220",width="441",class="attachment"}} * Typically, we would like to group the trials coming from multiple runs by experimental conditions. However, because of the subject's movements between runs, it's not possible to directly compare the sensor values between runs because they probably do not capture the brain activity coming from the same regions of the brain. * You have three options if you consider grouping information from multiple runs: * '''Method 1''': Process all the runs separately and average between runs at the source level: The more accurate option, but requires a lot more work, computation time and storage. * '''Method 2''': Ignore movements between runs: This can be acceptable for commodity if the displacements are really minimal, less accurate but much faster to process and easier to manipulate. * '''Method 3''': Co-register properly the runs using the process Standardize > Co-register MEG runs: Can be a good option for displacements under 2cm. Warning: This method has not be been fully evaluated on our side, to use at your own risk. * In this tutorial, we will illustrate only method 1: runs are not co-registered. |
Tutorial 4: Co-registration MEG-MRI
Authors: Francois Tadel, Elizabeth Bock, Sylvain Baillet
The anatomy of your subject is ready. Before we can start looking at the MEG/EEG recordings, we need to make sure that the sensors (electrodes, magnetometers or gradiometers) are properly aligned with the MRI and the surfaces of the subject.
In this tutorial, we will start with a detailed description of the experiment and the files that were recorded, then we will link the original CTF files to the database in order to get access to the sensors positions, and finally we will explore the various options for aligning these sensors on the head of the subject.
Contents
Include: Nothing found for "\<\
License
This dataset (MEG and MRI data) was collected by the MEG Unit Lab, McConnell Brain Imaging Center, Montreal Neurological Institute, McGill University, Canada. The original purpose was to serve as a tutorial data example for the Brainstorm software project. It is presently released in the Public Domain, and is not subject to copyright in any jurisdiction.
We would appreciate though that you reference this dataset in your publications: please acknowledge its authors (Elizabeth Bock, Peter Donhauser, Francois Tadel and Sylvain Baillet) and cite the Brainstorm project seminal publication.
Presentation of the experiment
Experiment
- One subject, two acquisition runs of 6 minutes each.
- Subject stimulated binaurally with intra-aural earphones (air tubes+transducers), eyes opened and looking at a fixation cross on a screen.
- Each run contains:
- 200 regular beeps (440Hz).
- 40 easy deviant beeps (554.4Hz, 4 semitones higher).
- Random inter-stimulus interval: between 0.7s and 1.7s seconds, uniformly distributed.
- The subject presses a button when detecting a deviant with the right index finger.
- Auditory stimuli generated with the Matlab Psychophysics toolbox.
The specifications of this dataset were discussed initially on the FieldTrip bug tracker:
http://bugzilla.fieldtriptoolbox.org/show_bug.cgi?id=2300.
MEG acquisition
Acquisition at 2400Hz, with a CTF 275 system, subject in sitting position
- Recorded at the Montreal Neurological Institute in December 2013
- Anti-aliasing low-pass filter at 600Hz, files saved with the 3rd order gradient
Downsampled at a lower sampling rate: from 2400Hz to 600Hz: The only purpose for this resampling is to make the introduction tutorials easier to follow the on a regular computer.
- Recorded channels (340):
- 1 Stim channel indicating the presentation times of the audio stimuli: UPPT001 (#1)
- 1 Audio signal sent to the subject: UADC001 (#316)
- 1 Response channel recordings the finger taps in response to the deviants: UDIO001 (#2)
- 26 MEG reference sensors (#5-#30)
- 274 MEG axial gradiometers (#31-#304)
- 2 EEG electrodes: Cz, Pz (#305 and #306)
- 1 ECG bipolar (#307)
- 2 EOG bipolar (vertical #308, horizontal #309)
- 12 Head tracking channels: Nasion XYZ, Left XYZ, Right XYZ, Error N/L/R (#317-#328)
- 20 Unused channels (#3, #4, #310-#315, #329-340)
- 3 datasets:
S01_AEF_20131218_01_600Hz.ds: Run #1, 360s, 200 standard + 40 deviants
S01_AEF_20131218_02_600Hz.ds: Run #2, 360s, 200 standard + 40 deviants
S01_Noise_20131218_02_600Hz.ds: Empty room recordings, 30s long
- Average reaction times for the button press after a deviant tone:
Run #1: 515ms +/- 108ms
Run #2: 596ms +/- 134ms
Stimulation delays
Delay #1: Production of the sound.
Between the stim markers (channel UDIO001) and the moment when the sound card plays the sound (channel UADC001). This is mostly due to the software running on the computer (stimulation software, operating system, sound card drivers, sound card electronics). The delay can be measured from the recorded files by comparing the triggers in the two channels: Delay between 11.5ms and 12.8ms (std = 0.3ms) This delay is not constant, we will need to correct for it.Delay #2: Transmission of the sound.
Between when the sound card plays the sound and when the subject receives the sound in the ears. This is the time it takes for the transducer to convert the analog audio signal into a sound, plus the time it takes the sound to travel through the air tubes from the transducer to the subject's ears. This delay cannot be estimated from the recorded signals: before the acquisition, we placed a sound meter at the extremity of the tubes to record when the sound is delivered. Delay between 4.8ms and 5.0ms (std = 0.08ms). At a sampling rate of 2400Hz, this delay can be considered constant, we will not compensate for it.Delay #3: Recording of the signals.
The CTF MEG systems have a constant delay of 4 samples between the MEG/EEG channels and the analog channels (such as the audio signal UADC001), because of an anti-aliasing filter that is applied to the first and not the second. This translate here to a constant delay of 1.7ms.Delay #4: Over-compensation of delay #1.
When correcting of delay #1, the process we use to detect the beginning of the triggers on the audio signal (UADC001) sets the trigger in the middle of the ramp between silence and the beep. We "over-compensate" the delay #1 by 1.7ms. This can be considered as constant delay of about -1.7ms.Uncorrected delays: We will correct for the delay #1, and keep the other delays (#2, #3 and #4). After we compensate for delay #1 our MEG signals will have a constant delay of about 4.9 + 1.7 - 1.7 = 4.9 ms. We decide not to compensate for these delays because they do not introduce any jitter in the responses and they are not going to change anything in the interpretation of the data.

Head shape and fiducial points
3D digitization using a Polhemus Fastrak device driven by Brainstorm (S01_20131218_01.pos)
More information: Digitize EEG electrodes and head shape
- The output file is copied to each .ds folder and contains the following entries:
- The position of the center of CTF coils.
The position of the anatomical references we use in Brainstorm:
Nasion and connections tragus/helix, as illustrated here.- Around 150 head points distributed on the hard parts of the head (no soft tissues).
Subject anatomy
- Subject with 1.5T MRI
- Marker on the left cheek
Processed with FreeSurfer 5.3
Tutorials using this dataset
- All the introduction tutorials
Link the raw files to the database
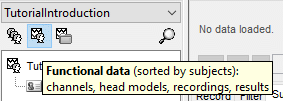
Switch to the "functional data" view.
Right-click on the subject folder > Review raw file
Select the file format: "MEG/EEG: CTF (*.ds...)"
Select all the .ds folders in: sample_introduction/data

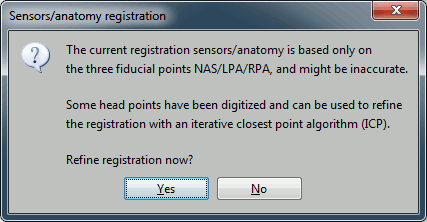
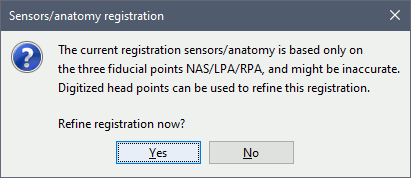
Refine registration now? YES
Registration with MRI
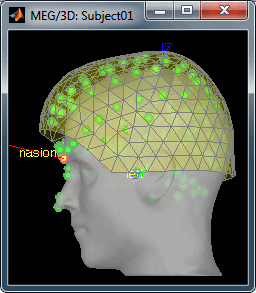
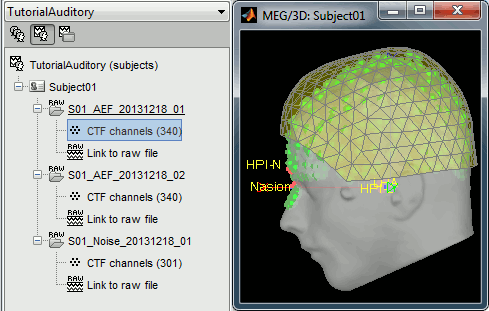
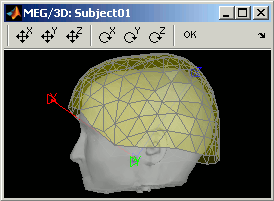
This operation improves the initial MRI/MEG registration by fitting the head points digitized before the MEG acquisition on the scalp surface with an ICP algorithm. Answer yes. Even if the result is not perfect, it usually improves the positioning of the head in the MEG helmet. The grey surface represents the head extracted from the MRI, the yellow surface represents the inside of the MEG helmet, and the green dots are the head shape points digitized with the Polhemus device; the goal is to align the green points on the grey surface.- Two new files appeared in the database explorer:
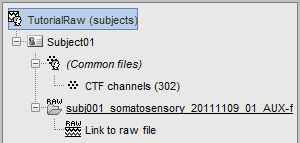
The channel file contains the definition of the sensors, exactly as when importing the files in the database with the "Import MEG/EEG" menu. It is saved in the folder (Common files), because the subject was created using the option "Yes, use one channel file per subject". Therefore, the same channel file will be used for all the folders of Subject01.
- The node named "Link to raw file" contains all the information that was read from the continuous file (file format, time vector, sampling frequency, events, bad channels, path to the original file, etc.), but no recordings. The MEG and EEG values recorded will be read directly from the native file.
Brainstorm offers the possibility to visualize continuous MEG/EEG recordings in any of the supported file formats without having to fully "import" them. A link to the native file is created in the database, which can be then manipulated almost like the "imported" recording blocks. Only the description of the file is saved in the database, and when displaying it the values are read directly from the native file.
- A common source of confusion for beginners is the difference between the two menus that allow you to bring external data into the Brainstorm environment:
Review raw file: Allows you to create a link to your original data file. It reads the header and sensor information from the file and saves it in the database as a
From auditory
Link the recordings
- Switch to the "functional data" view.
Right-click on the subject folder > Review raw file
Select the file format: "MEG/EEG: CTF (*.ds...)"
Select all the .ds folders in: sample_introduction/data
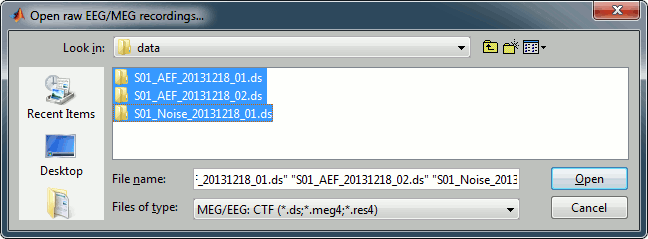
Refine registration now? YES
Multiple runs and head position
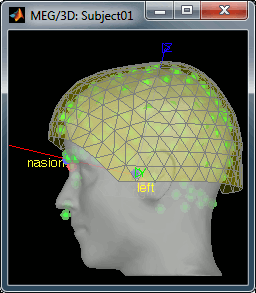
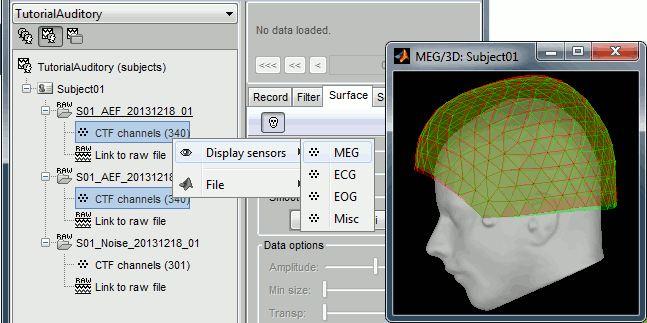
The two AEF runs 01 and 02 were acquired successively, the position of the subject's head in the MEG helmet was estimated twice, once at the beginning of each run. The subject might have moved between the two runs. To evaluate visually the displacement between the two runs, select at the same time all the channel files you want to compare (the ones for run 01 and 02), right-click > Display sensors > MEG.
- Typically, we would like to group the trials coming from multiple runs by experimental conditions. However, because of the subject's movements between runs, it's not possible to directly compare the sensor values between runs because they probably do not capture the brain activity coming from the same regions of the brain.
- You have three options if you consider grouping information from multiple runs:
Method 1: Process all the runs separately and average between runs at the source level: The more accurate option, but requires a lot more work, computation time and storage.
Method 2: Ignore movements between runs: This can be acceptable for commodity if the displacements are really minimal, less accurate but much faster to process and easier to manipulate.
Method 3: Co-register properly the runs using the process Standardize > Co-register MEG runs: Can be a good option for displacements under 2cm. Warning: This method has not be been fully evaluated on our side, to use at your own risk.
- In this tutorial, we will illustrate only method 1: runs are not co-registered.
From CTF
Channel file
Let's explore what you can do with the first file. Right-click on the CTF channels file and try all the menus.
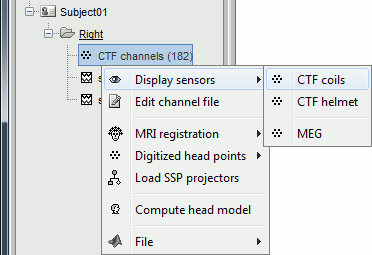
Menu: Display
The menus in the Display menu display the same thing, but in a different way. You can add the scalp (or cortex) surface easily with the toolbar in the Surfaces tab, in the main window (Add a surface "+" button).
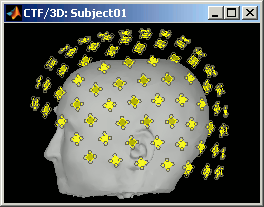
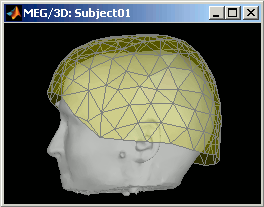
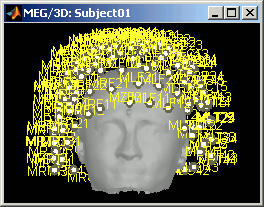
CTF coils: Display the coils of this CTF MEG system: they are all axial gradiometers, only the coils close to the head are represented. The coils are represented the way there are processed in the forward model computation. The small squares do not represent exactly the reality, as CTF coils are circular, but the way they are modeled.
CTF Helmet: Show a surface that represents the inner surface of the MEG helmet (ie. the plastic surface that the subject's head is almost supposed to touch). This view is useful for verifying that the registration is correct: if the registration is really wrong, there is a high chance that you would observe the scalp and helmet surfaces intersecting.
MEG: MEG sensors are represented as small white dots (centers of the coils close to the head), and can be selected by clicking on them.
Menu: Edit channel file
Display a table with all the information about the individual channels. You can use this window to view and edit the channels properties.

The channel file describes each channel separately, with the following information:
Index : Index of the channel, which is also the index of the row in the data matrix ('F' field in the recordings file). You can edit this field if you need to reorder the channels (might be useful for EEG recordings).
Name : Name that was given to the channel by the acquisition device.
Type : Channel type, eg. MEG, EEG, EOG, ECG, EMG, Stim, Other, etc.
- Sometimes you have to change the Type for some sensors. For instance if the EOG channel was saved as a regular EEG channel, you have to change its type to prevent it from being used in the source estimation.
- To delete a channel from this file: select "(Delete)" in the type column, and then save the window to save the file.
Comment : Description of the channel.
Loc : Indicates the position in space of the sensor (x,y,z coordinates). One column per coil and per integration point. You should not modify these values from this interface.
Orient : Indicates the orientation of the coil (x,y,z coordinates). One column per coil or per integration point.
Weight : When there are more than one coil or integration point, the Weight field indicates the multiplication factor to apply to each of these points.
Menu: MRI Registration
For the moment, the registration between anatomy and sensors is based only on three points that are manually positioned (nasion and ears). This rough alignment technique is quite robust but also very imprecise, and depends on the precision with which the people defined the fiducials, both during the data acquisition and on the MRI slices. For this reason, it is sometimes necessary to correct the position of the sensors.
Check: Show all the possible information that may help to verify the registration between the sensors and the anatomy. For those specific recordings, it would just show the head surface, and the inner helmet surface, exactly like the "Display sensors > CTF Helmet" menu.
Edit...: Opens a window where you can move manually the MEG helmet relatively to the head. It works the same way as the interface to co-register surfaces presented in the previous tutorial: select an operation by clicking on it in the toolbar, and then right-click+move up/down to apply it. From a scientific point of view it is not a exactly a rigorous operation, but sometimes it is much better than using wrong default positions.
Refine using head points: If some digitized head points are available, this menu launches an iterative algorithm that uses those points to try to get a better MRI/sensors registration. In our case, there are no such points that were acquired, and you will get an error message if you select this menu.
There is nothing to change here, but remember to always check the registration scalp/sensors just after you import MEG or EEG recordings.
Menu: Digitized head points
Before locking your subject into that dark shielded room, when you acquire the position of some reference points with a magnetic tracking system (eg. Polhemus Isotrak), it is a good practice to acquire also many other points at the surface of the head. It does not take a very long time but provides very valuable information to register properly the MEG sensors with the MRI and surfaces. The more head points the better, with a minimum of 50 or 100, avoiding the softer parts of the head (cheeks, base of the neck, ears, eyes) because they may have different shapes when the patient is sitting on the MEG chair and when he/she is laying down in the MR scanner. Always insist on the nose, it provides a really good indicator of the orientation of the head.
View head points: Visualize the head points that were digitized before the MEG acquisition. There are no extra points here, so you will have to read another tutorial to play with those menus.
Add points: Add extra head points to the existing ones, from any type of file.
Remove all points: Removes all the currently defined head points.
Warp: Use those digitized head points to create a pseudo-individual anatomy, in the case you don't have an individual MRI for the subject. It uses the default anatomy (MNI/Colin27) and deforms it to match the head points. Make sure the alignment is correct before calling this menu. This step is described better in this page.
Note: The digitization of the head shape and the head localization coils with a Polhemus device can be done with Brainstorm: see the digitize tutorial.
Menu: File
Some other fields are present in the channel file that cannot be accessed with the Channel editor window. You can explore those other fields with the File menu, selecting View file contents or Export to Matlab. As we saw in previous tutorial.
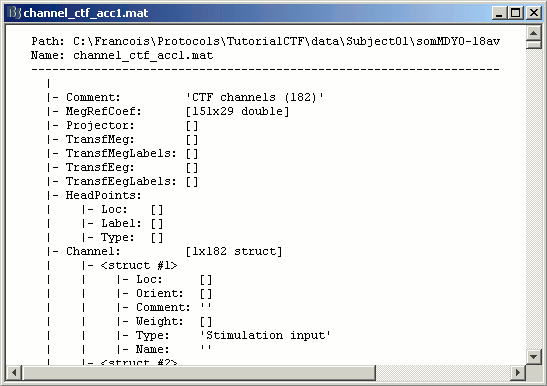
Some fields you may find there:
Comment : String that is displayed in the Brainstorm database explorer
MegRefCoef: Noise compensation matrix for CTF recordings, which is computed by the CTF systems, based on some other sensors that are located far away from the head.
Projector: SSP projectors used for denoising purposes.
TransfMeg / TransfMegLabel: Transformations that were applied to the positions of the MEG sensors to bring them in the Brainstorm coordinate system (as Brainstorm and CTF coordinate systems are the same, this field is empty).
TransfEeg / TransfEegLabel: Same for the position of the EEG electrodes.
HeadPoints: Extra head points that were digitized with a tracking system.
Channel: An array that defines each channel individually
History: Describes all the operations that were performed with Brainstorm on this file. To get a better view of this piece of information, use the menu File > View file history.

