last edit: Apr. 3, 2021 by Yaqi
Loading Connectivity Graphs
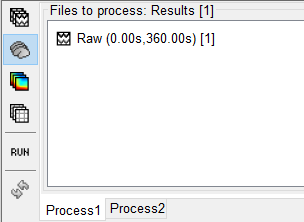
1. Drag the selected raw file into the process block. Ensure the "Process Sources" is selected on the left-hand side.

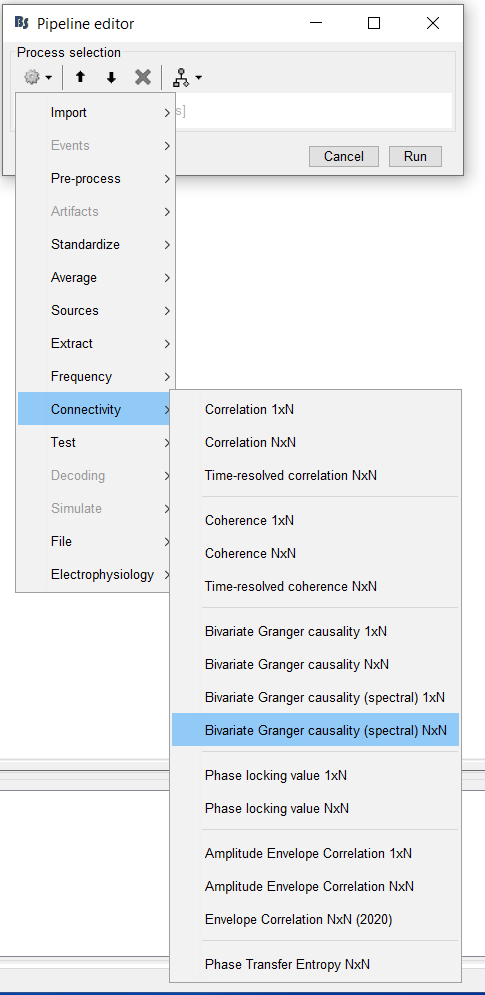
2. In the pipeline editor select "Connectivity", and choose the type of connectivity you would like to load. In this tutorial, we will begin with a Correlation N x N graph.

3. Once loaded, you should see the graph being listed under the raw file. Right-click on the graph and select "". The graph should appear on your screen shortly.
4. The steps in the following sections will guide you through the display options available in this tool.
Threshold Filtering
1. In the display panel, you have the option to adjust the minimum intensity threshold, which is the minimum connectivity score that will be displayed on your graph. Move the slider to the left. You should see more connectivity links appear.
