|
Size: 10197
Comment:
|
Size: 18031
Comment:
|
| Deletions are marked like this. | Additions are marked like this. |
| Line 7: | Line 7: |
| You probably noticed colored dots on top of the recordings in the MEG figure. They represent the event markers saved in this dataset. In this documentation, they can be called indifferently '''events''', '''markers '''or '''triggers'''. Some are stimulus triggers that were generated by the stimulation computer (Psychtoolbox-3), others are the subject responses recorded from a button box. This tutorial shows how to manipulate those markers. * Open the MEG recordings for file '''AEF#01'''. * Make sure it is configured as presented here: Montage "CTF LF", [DC] button selected, 3s pages. |
You probably noticed colored dots on top of the recordings in the MEG figure. They represent the event markers saved in this dataset. In this documentation, they can be called indifferently '''events''', '''markers '''or '''triggers'''. Some are stimulus triggers that were generated by the stimulation computer (Psychtoolbox-3), others are the subject responses recorded from a button box. This tutorial shows how to manipulate these markers. * Open the MEG recordings for file '''AEF#01.''' * Make sure it is configured as presented here: Montage "CTF LT", [DC] button selected, 3s pages. |
| Line 15: | Line 15: |
| * '''49 button''' responses: The subject presses a button with the right index finger when a deviant is presented. This is a very easy task so all the deviants are detected. Because of some issues with the way this CTF system saves the triggers, some are doubled, which explains the 49 responses for 40 deviants. In most cases, only the first one is to be consider. We will check this in the next tutorial. | * '''40 button''' responses: The subject presses a button with the right index finger when a deviant is presented. This is a very easy task so all the deviants are detected |
| Line 18: | Line 18: |
| * Those two lists are interactive. If you click on a event group (left list), it shows the corresponding occurrences in the right list. If you click on one particular event in the right list, the file viewer jumps to it. It works the other way as well: if you click on a dot representing an event in the MEG figure, the corresponding event group and occurrence are selected in the Record tab. <<BR>><<BR>> {{attachment:events_list.gif||height="205",width="591"}} | * These two lists are interactive. If you click on an event group (left list), it shows the corresponding occurrences in the right list. If you click on one particular event in the right list, the file viewer jumps to it. It works the other way as well: if you click on a dot representing an event in the MEG figure, the corresponding event group and occurrence are selected in the Record tab. <<BR>><<BR>> {{attachment:events_list.gif||width="591",height="205"}} |
| Line 24: | Line 24: |
| * Click on this new category to select it. It contains no occurrences at the beginning (x0). <<BR>><<BR>> {{attachment:events_newgroup.gif||height="112",width="504"}} | * Click on this new category to select it. It contains no occurrences at the beginning (x0). <<BR>><<BR>> {{attachment:events_newgroup.gif}} |
| Line 29: | Line 29: |
| * In the time series figure: Press '''Ctrl + E ''' * Note that you can click outside of the white area to select the time (on top of the figure), or use the shortcut '''Shift+click'''. If the display is too dense, it can be difficult to set the current time instead of selecting a channel. <<BR>><<BR>> {{attachment:events_newmarker.gif||height="137",width="555"}} |
* In the time series figure: Press key '''E ''' * If the display is too dense, it can be difficult to set the current time instead of selecting a channel. Note that you can click outside of the white area to select the time (on top of the figure), or use the shortcut '''Shift+click'''. <<BR>><<BR>> {{attachment:events_newmarker.gif}} |
| Line 33: | Line 33: |
| * In the time series figure: Click on an event dot and right-click > '''Add / delete event ''' * In the time series figure: Click on an event dot and press '''Ctrl + E''' |
* In the time series figure: Click on an event dot and right-click > '''Add / delete event'''. * In the time series figure: Click on an event dot and press key '''E'''. |
| Line 40: | Line 40: |
| * Add an event: menus or Ctrl+E. * The first occurrence you add in an event group defines its type: single time point (simple events), or time range (extended events). You cannot mix different types of events in a group. You get an error when you try to add a time segment in a event category that already contains a simple event.<<BR>><<BR>> {{attachment:events_extended.gif||height="140",width="570"}} |
* Add an event: menus or key '''E'''. * The first occurrence you add in an event group defines its type: single time point (simple events), or time range (extended events). You cannot mix different types of events in a group. You get an error when you try to add a time segment in an event category that already contains a simple event.<<BR>><<BR>> {{attachment:events_extended.gif}} |
| Line 44: | Line 44: |
| == Custom shortcuts == When reviewing long recordings and adding manually lots of events (eg. when marking manually epileptic spikes), using the menus presented above is not convenient because they require many mouse clicks. Using the menu '''Events > Edit keyboard shortcuts''', you can associate custom events to the key 1 to 9 of the keyboard. Define the name of the event type to create for each key, and then simply press the corresponding key to add/delete a marker at the current time position. {{attachment:events_shortcuts.gif||height="329",width="666"}} |
|
| Line 52: | Line 45: |
| It is very common to have portions of the recordings heavily contaminated by events coming from the subject (eye blinks, movements, heartbeats, teeth clenching) or from the environment (stimulation equipment, elevators, cars, trains, building vibrations...). Some of them are well defined and can be removed efficiently, some are too complex to be modeled efficiently. For this last category, it is usually safer to mark the noisy segments as bad, and ignore them for the rest of the analysis. To mark a segment of recordings as bad, the procedure is the same as for defining an extended event: select a time window, and then tag it as bad with one of the following methods. |
It is very common to have portions of the recordings heavily contaminated by events coming from the subject (eye blinks, movements, heartbeats, teeth clenching) or from the environment (stimulation equipment, elevators, cars, trains, building vibrations...). Some of them are well defined and can be removed efficiently, some are too complex to be modeled efficiently. For this last category, it is usually safer to mark the noisy segments as bad, and ignore them for the rest of the analysis. To mark a segment of recordings as bad, the procedure is the same as for defining an extended event: select a time window, and then tag it as bad with one of the following methods. |
| Line 60: | Line 53: |
| It creates a new event group BAD, and adds an extended event to it. Later, when epoching this file (extracting time blocks and saving them in the database), the trials that contain a bad segment will be imported but tagged as bad, and ignored in the rest of the analysis. You can create multiple groups of bad segments, for instance to identify different types of artifacts. Any event group that contains the tag "BAD" will be considered as indicating bad segments. {{attachment:events_bad.gif||height="140",width="595"}} |
It creates a new event group BAD, and adds an extended event to it. Later, when epoching this file (extracting time blocks and saving them in the database), the trials that contain a bad segment will be imported but tagged as bad, and ignored in the rest of the analysis. You can create multiple groups of bad segments, for instance to identify different types of artifacts. Any event group that contains the tag "BAD" will be considered as indicating bad segments. {{attachment:events_bad.gif||width="595",height="140"}} <<TAG(Advanced)>> == Hide event groups == When you have too many events in the viewer, seeing the ones you are interested in can be difficult. This will be the case for insteance after we detect the heartbeats in the signal, we will have one event every second, which is not always interesting to see. Each event category can be selectively hidden. * In the record tab, select the group of events you want to hide. * Use the menu '''Events > Show/Hide group''', or press shortcut key '''H'''. * The event group is greyed out, and the corresponding markers disappear from the viewer.<<BR>><<BR>> {{attachment:events_hide.gif}} <<TAG(Advanced)>> == Channel events == Some events can be attached to only one or a few channels. This is useful for instance for reviewing clinical EEG recordings, where neurologists are tagging epileptic activity only on a subset of the channels. * First select the channels of interest by clicking on them (the signals should turn red). * Place the time cursor where you want to create the event (click on the white or grey areas of the figure, or use the shortcut Shift+Click). * Right-click anywhere on the figure > '''Add/delete channel event''', or shortcut '''Ctrl+E'''. * The event marker appears directly on the selected channel, and the name of the channel appears in the list of event times (in the Brainstorm window). <<BR>><<BR>> {{attachment:events_channel.gif}} * Then you can deselect the channel (click again on it) or press the '''Escape''' key before creating a new event attached to a different channel. * If no channel is selected, you can proceed in this alternate way: position the time cursor where you want to create the event, right-click directly on the channel to which to want to attach the event, and select "Add/delete channel event". <<TAG(Advanced)>> == Notes == Additional comments can be added to the event, in case additional details should be displayed in the file viewer. This is mostly useful for reviewing clinical recordings as well. * Right-click on any event marker or event text (or double-click on it) > '''Edit notes'''. * Enter the text to display next to the marker. <<BR>><<BR>> {{attachment:events_note.gif}} * Alternatively, you can '''double-click''' on the event in the list of event times (in the Brainstorm window). <<TAG(Advanced)>> == Display modes == Three display modes are available for the event markers: '''dots''', '''lines '''or '''hidden'''. Select the corresponding menu in the display options, or press '''CTRL+L''' multiple times. {{attachment:events_dots.gif}} {{attachment:events_lines.gif}} <<TAG(Advanced)>> == Custom shortcuts == When reviewing long recordings and adding manually lots of events (eg. when marking manually epileptic spikes), using the menus presented above is not convenient because they require many mouse clicks. Using the menu '''Events > Edit keyboard shortcuts''', you can associate custom events to the key 1 to 9 of the keyboard. Define the name of the event type to create for each key, and then simply press the corresponding key to add/delete a marker at the current time position. Three options are available for each event type: * '''Simple''': Create a simple event where the red time cursor is placed. * '''Full page''': Create an extended event including the entire page of recordings, then move to the next page of recordings. This option was added for a specific application (sleep staging) that consists in labelling blocks of 30s through the entire file. * '''Extended''': Create an extended event with the time window indicated on the right of the panel around the time cursor. {{attachment:events_shortcuts.gif}} |
| Line 73: | Line 118: |
| {{attachment:events_save.gif||height="130",width="378"}} Note that events you edit are not saved automatically until that moment. As you would do with any other type of computer work, save your work regularly, to limit the damages of a program or computer crash. In the Record tab, use the menu ''' File > Save modifications'''. |
{{attachment:events_save.gif||width="378",height="130"}} Note that events you edit are not automatically saved until that moment. As you would do with any other type of computer work, save your work regularly, to limit the damages of a program or computer crash. In the Record tab, use the menu ''' File > Save modifications'''. <<TAG(Advanced)>> |
| Line 78: | Line 125: |
| {{http://neuroimage.usc.edu/brainstorm/Tutorials/TutRawViewer?action=AttachFile&do=get&target=menuFile.gif|menuFile.gif|height="316",width="407",class="attachment"}} | {{attachment:events_menus.gif||width="338",height="376"}} |
| Line 84: | Line 131: |
| * '''Read events from channel''': Read the information saved during the acquisition in an digital auxiliary channel (eg. a stimulus channel) and generate events. | * '''Read events from channel''': Read the information saved during the acquisition in a digital auxiliary channel (eg. a stimulus channel) and generate events. * '''Detect analog triggers''': Detect transition events in an external analog channel, such as the voltage of a photodiode exposed to light or a microphone recording a sound. |
| Line 91: | Line 139: |
| * '''Mark group as bad''': Add a tag "bad" in the event name, so that it is considered as bad segment. * '''Sort groups''': Reorders the event groups by name, or by time of the first occurrence. |
|
| Line 92: | Line 142: |
| * '''Combine stim/response''': Shortcut to call the process "Import recordings > Combine stim/response", to create new groups of events based on stim/response logic. <<BR>>Example: Stimulus A can be followed by response B or C. Use this process to split the group A in two groups: AB, followed by B; and AC, followed by C. | |
| Line 94: | Line 143: |
| * '''Convert to simple events''': Convert a group of extended events (several time points for each event), to simple events (one time point). An option window asks you whether to keep the first or the last sample only of the extended events. | * '''Convert to simple events''': Convert a group of extended events (several time points for each event), to simple events (one time point). An option window asks you whether to keep the first or the last sample only of the extended events. * '''Convert to extended events''': Convert simple events to segments of a fixed length. * '''Combine stim/response''': Create new groups of events based on stim/response logic. <<BR>>Example: Stimulus A can be followed by response B or C. Use this process to split the group A in two groups: AB, followed by B; and AC, followed by C. * '''Detect multiple responses''': Finds the multiple responses (events that are too close to each other) * '''Group by name''': Combine different event groups by name. * '''Group by time''': Combine simultaneous events and creates new event groups. * '''Add time offset''': Adds a constant time to all the events in a group, to compensate for a delay. |
| Line 99: | Line 154: |
| <<TAG(Advanced)>> == On the hard drive == The nodes "Link to raw file" you see in the database explorer are represented by .mat files on the hard drive. They contain all the header information extracted from the raw files, but do not contain a full copy of the recordings. All the additional information created from the Brainstorm interface (event markers, bad channels, SSP projectors) are not saved back to the original raw files, they are only saved in the "Link to raw file". The names of these files start with the tag '''data_0raw_''', they share the same structure as all the imported epochs (introduced later in the tutorials). To explore the contents of these link files, right-click on them use the popup menus '''File > View file contents''' or '''File > Export to Matlab'''. {{attachment:link_contents.gif||width="467",height="805"}} ==== Link to raw file structure: data_0raw_*.mat ==== * '''F''': sFile structure, documents completely the continuous raw file, described below.<<BR>>(for imported epochs, .F contains directly the MEG/EEG recordings [Nchannels x Ntime]) * '''Comment''': String used to represent the file in the database explorer. * '''Time''': First and last time points recorded in the continuous file. * '''ChannelFlag''': [Nchannels x 1] list of good/bad channels (good=1, bad=-1) * '''DataType''': Type of data stored in this file. * 'raw' = Link to a continuous raw file * 'recordings' = Imported epoch * '''Device''': Acquisition system that recorded the dataset. * '''Events''': Not used in the case of links. * '''nAvg''': Number of input files averaged to produce this file. * '''History''': Describes all the operations that were performed with Brainstorm on this file. To get a better view of this piece of information, use the menu '''File > View file history'''. <<BR>> '''sFile structure''': This structure is passed directly to all the input/output functions on continuous files. * '''filename''': Full path to the continuous raw file. * '''format''': Format of the continuous raw file. * '''device''': Acquisition system that recorded the dataset. Same as Link.Device. * '''condition''': Name of the folder in which this file is supposed to be displayed. * '''comment''': Original file comment. * '''byteorder''': Endianness, 'l' = Little Endian, 'b' = Big Endian * '''prop''': Structure, basic properties of the recordings * '''times''': First and last time points recorded in the continuous file. * '''sfreq''': Sampling frequency * '''nAvg''': Number of files that were averaged to produce this file. * '''currCtfComp''': Level of CTF compensation currently applied. * '''destCtfComp''': Level of CTF compensation in which we want to view the file (usually: 3) * '''epochs''': Array of structures used only in the case of continuous recordings saved as "epochs" * '''events''': Array of structures describing the event markers in the file, one structure per event group: * '''label''': Name of the event group * '''color''': [r,g,b] Color used to represent the event group, in Matlab format * '''epochs''': [1 x Nevt] Indicate in which epoch the event is located (index in the sFile.epochs array), or 1 everywhere for files that are not saved in "epoched" mode. <<BR>>Nevt = number or occurrences of the event = number of markers in this group * '''times''': [1 x Nevt] Time in seconds of each marker in this group (times = samples / sfreq).<<BR>>For extended events: [2 x Nevt], first row = start, second row = end * '''reactTimes''': Not used anymore * '''select''': Indicates if the event group should be displayed in the viewer. * '''channels''': {1 x Nevt} Cell array of cell-arrays of strings. Each event occurrence can be associated with one or more channels, by setting .channels{iEvt} to a cell-array of channel names. * '''notes''': {1 x Nevt} Cell-array of strings: additional comments for each event occurrence * '''header''': Structure describing additional header information, depending on the original file format. * '''channelflag''': List of good/bad channels, same information as Link.ChannelFlag. ==== Useful functions ==== * '''in_bst_data'''(DataFile, FieldsList): Read the structure for a data file. |
Tutorial 7: Event markers
Authors: Francois Tadel, Elizabeth Bock, John C Mosher
Contents
Lists of events
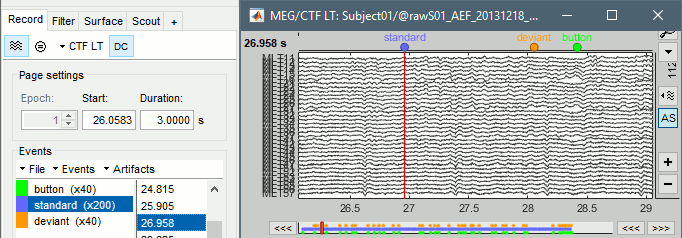
You probably noticed colored dots on top of the recordings in the MEG figure. They represent the event markers saved in this dataset. In this documentation, they can be called indifferently events, markers or triggers. Some are stimulus triggers that were generated by the stimulation computer (Psychtoolbox-3), others are the subject responses recorded from a button box. This tutorial shows how to manipulate these markers.
Open the MEG recordings for file AEF#01.
- Make sure it is configured as presented here: Montage "CTF LT", [DC] button selected, 3s pages.
- All the markers available in the file are listed in the Events section of the Record tab.
- On the left, you have the groups of events and the number of occurrence for each group:
200 standard audio stimulations
40 deviant audio stimulations
40 button responses: The subject presses a button with the right index finger when a deviant is presented. This is a very easy task so all the deviants are detected
- On the right, you have the list of the time instants at which the selected event occurs.
These two lists are interactive. If you click on an event group (left list), it shows the corresponding occurrences in the right list. If you click on one particular event in the right list, the file viewer jumps to it. It works the other way as well: if you click on a dot representing an event in the MEG figure, the corresponding event group and occurrence are selected in the Record tab.
Adding events
The markers can represent either stimulation triggers or subject responses that were recorded during the acquisition. It can also be useful to add new markers during the analysis of the recordings, to identify events of interest that are not detected at the time of the recordings, such as artifacts (eye movements, heartbeats, subject movements) or specific patterns of brain activity (epileptic spikes).
Create a new group of events "Test" with the menu Events > Add group.
Click on this new category to select it. It contains no occurrences at the beginning (x0).

- Then place the time cursor (red vertical bar) where you want to add a new marker "Test".
- Add a few occurrences with any of the three methods:
In the Record tab: Select the menu Events > Add / delete event
In the time series figure: Right-click > Add / delete event
In the time series figure: Press key E
If the display is too dense, it can be difficult to set the current time instead of selecting a channel. Note that you can click outside of the white area to select the time (on top of the figure), or use the shortcut Shift+click.

- Remove all the event occurrences in "Test", but not the group itself. Use any of the three methods:
In the Record tab: Select one or more event occurrences, press the Delete key.
In the time series figure: Click on an event dot and right-click > Add / delete event.
In the time series figure: Click on an event dot and press key E.
Extended events
You can also use this interface to create events that have a temporal extension, i.e., that last for more than one time sample. This can be used to define bad segments in the recordings.
- In the time series window, select a time range (click + move).
Add an event: menus or key E.
The first occurrence you add in an event group defines its type: single time point (simple events), or time range (extended events). You cannot mix different types of events in a group. You get an error when you try to add a time segment in an event category that already contains a simple event.

Remove the event group "Test": Click on it in the list and press the Delete key.
Bad segments
It is very common to have portions of the recordings heavily contaminated by events coming from the subject (eye blinks, movements, heartbeats, teeth clenching) or from the environment (stimulation equipment, elevators, cars, trains, building vibrations...). Some of them are well defined and can be removed efficiently, some are too complex to be modeled efficiently. For this last category, it is usually safer to mark the noisy segments as bad, and ignore them for the rest of the analysis.
To mark a segment of recordings as bad, the procedure is the same as for defining an extended event: select a time window, and then tag it as bad with one of the following methods.
In the Record tab: Select the menu Events > Reject time segment,
In the time series figure: Right-click > Reject time segment,
In the time series figure: Press Ctrl + B
It creates a new event group BAD, and adds an extended event to it. Later, when epoching this file (extracting time blocks and saving them in the database), the trials that contain a bad segment will be imported but tagged as bad, and ignored in the rest of the analysis.
You can create multiple groups of bad segments, for instance to identify different types of artifacts. Any event group that contains the tag "BAD" will be considered as indicating bad segments.

Hide event groups
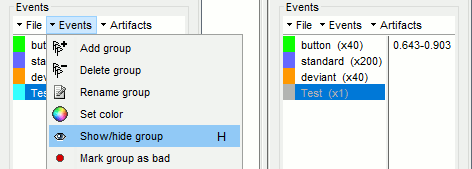
When you have too many events in the viewer, seeing the ones you are interested in can be difficult. This will be the case for insteance after we detect the heartbeats in the signal, we will have one event every second, which is not always interesting to see. Each event category can be selectively hidden.
- In the record tab, select the group of events you want to hide.
Use the menu Events > Show/Hide group, or press shortcut key H.
The event group is greyed out, and the corresponding markers disappear from the viewer.
Channel events
Some events can be attached to only one or a few channels. This is useful for instance for reviewing clinical EEG recordings, where neurologists are tagging epileptic activity only on a subset of the channels.
- First select the channels of interest by clicking on them (the signals should turn red).
- Place the time cursor where you want to create the event (click on the white or grey areas of the figure, or use the shortcut Shift+Click).
Right-click anywhere on the figure > Add/delete channel event, or shortcut Ctrl+E.
The event marker appears directly on the selected channel, and the name of the channel appears in the list of event times (in the Brainstorm window).

Then you can deselect the channel (click again on it) or press the Escape key before creating a new event attached to a different channel.
- If no channel is selected, you can proceed in this alternate way: position the time cursor where you want to create the event, right-click directly on the channel to which to want to attach the event, and select "Add/delete channel event".
Notes
Additional comments can be added to the event, in case additional details should be displayed in the file viewer. This is mostly useful for reviewing clinical recordings as well.
Right-click on any event marker or event text (or double-click on it) > Edit notes.
Enter the text to display next to the marker.

Alternatively, you can double-click on the event in the list of event times (in the Brainstorm window).
Display modes
Three display modes are available for the event markers: dots, lines or hidden. Select the corresponding menu in the display options, or press CTRL+L multiple times.


Custom shortcuts
When reviewing long recordings and adding manually lots of events (eg. when marking manually epileptic spikes), using the menus presented above is not convenient because they require many mouse clicks.
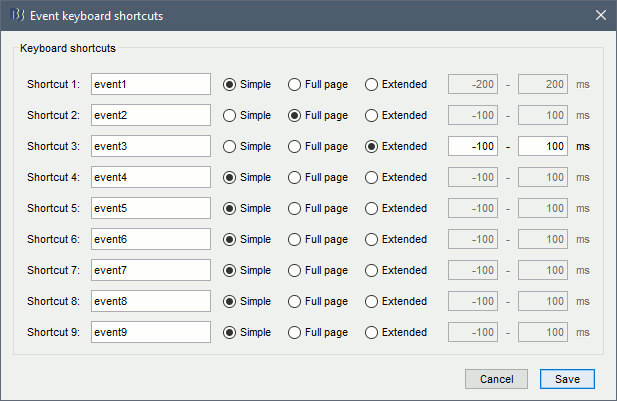
Using the menu Events > Edit keyboard shortcuts, you can associate custom events to the key 1 to 9 of the keyboard. Define the name of the event type to create for each key, and then simply press the corresponding key to add/delete a marker at the current time position. Three options are available for each event type:
Simple: Create a simple event where the red time cursor is placed.
Full page: Create an extended event including the entire page of recordings, then move to the next page of recordings. This option was added for a specific application (sleep staging) that consists in labelling blocks of 30s through the entire file.
Extended: Create an extended event with the time window indicated on the right of the panel around the time cursor.
Saving modifications
Now you can delete all the event groups that you've just created and leave only the initial ones (button, standard, deviant): select the event groups and press Delete, or use the menu Events > Delete group.
When you close the continuous file viewer, or the last figure that shows a part of the raw file, the dataset is unloaded, the file is released and the memory is freed.
If you edited the events for this file, you are asked whether to save the modifications or not. If you answer "Yes", the modifications are saved only in the database link (Link to raw file), not in the original file itself. Therefore, you would see the changes the next time you double-click on the "link to raw file" again, but not if you open the original .ds file in another protocol or with an external program.
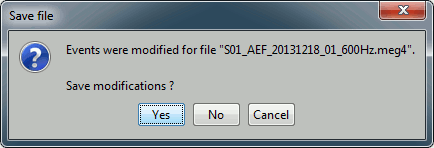
Note that events you edit are not automatically saved until that moment. As you would do with any other type of computer work, save your work regularly, to limit the damages of a program or computer crash. In the Record tab, use the menu File > Save modifications.
Other menus
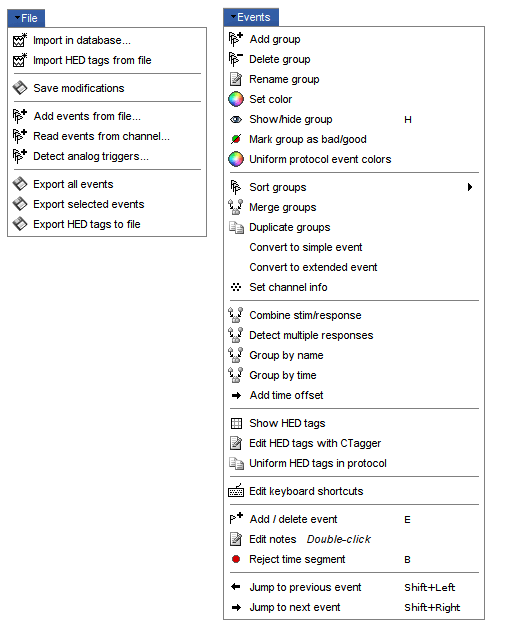
File
Import in database: Import blocks of the current continuous file into the database. Equivalent to a right click on the "Link to raw file" in the database explorer > Import in database.
Save modifications: Save the modifications made to the events in the database link.
Add events from file: Import events from an external file. Many file formats are supported.
Read events from channel: Read the information saved during the acquisition in a digital auxiliary channel (eg. a stimulus channel) and generate events.
Detect analog triggers: Detect transition events in an external analog channel, such as the voltage of a photodiode exposed to light or a microphone recording a sound.
Export all events: Save all the events in an external file.
Export selected events: Same as "Export all events" but exports only the selected events.
Events
Rename group: Rename the selected group of events. Shortcut: double-click.
Set color: Change the color associated with an event group.
Mark group as bad: Add a tag "bad" in the event name, so that it is considered as bad segment.
Sort groups: Reorders the event groups by name, or by time of the first occurrence.
Merge groups: Merge two event groups into a new group. Initial groups are deleted. To keep them, duplicate them before merging.
Duplicate groups: Make a copy of the selected event groups.
Convert to simple events: Convert a group of extended events (several time points for each event), to simple events (one time point). An option window asks you whether to keep the first or the last sample only of the extended events.
Convert to extended events: Convert simple events to segments of a fixed length.
Combine stim/response: Create new groups of events based on stim/response logic.
Example: Stimulus A can be followed by response B or C. Use this process to split the group A in two groups: AB, followed by B; and AC, followed by C.Detect multiple responses: Finds the multiple responses (events that are too close to each other)
Group by name: Combine different event groups by name.
Group by time: Combine simultaneous events and creates new event groups.
Add time offset: Adds a constant time to all the events in a group, to compensate for a delay.
Edit keyboard shortcuts: Custom associations between keys 1..9 and events
Reject time segment: Mark the current time selection as bad.
Jump to previous/next event: Convenient way of browsing through all the markers in a group.
Shortcut: Shift + left/right
On the hard drive
The nodes "Link to raw file" you see in the database explorer are represented by .mat files on the hard drive. They contain all the header information extracted from the raw files, but do not contain a full copy of the recordings.
All the additional information created from the Brainstorm interface (event markers, bad channels, SSP projectors) are not saved back to the original raw files, they are only saved in the "Link to raw file". The names of these files start with the tag data_0raw_, they share the same structure as all the imported epochs (introduced later in the tutorials).
To explore the contents of these link files, right-click on them use the popup menus File > View file contents or File > Export to Matlab.
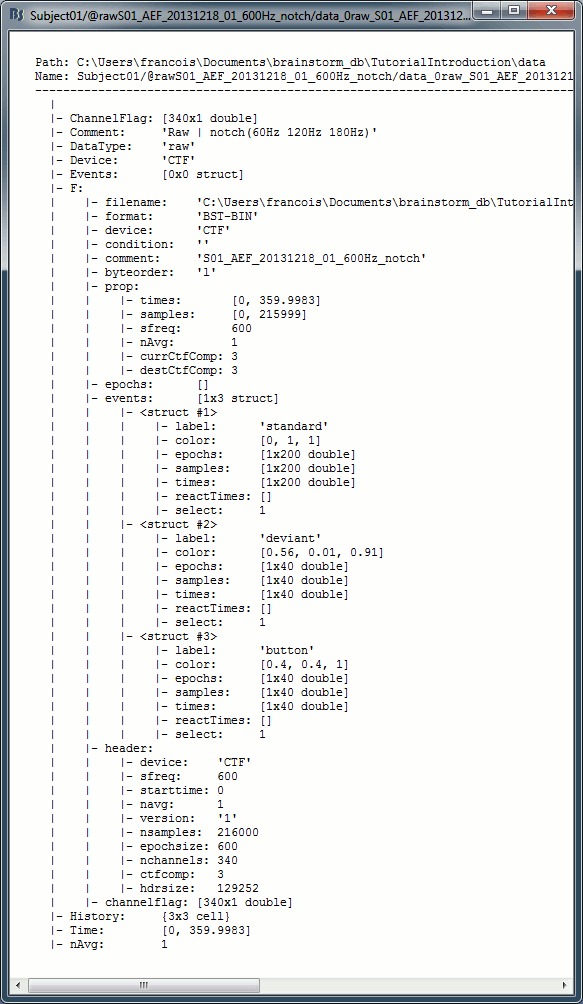
Link to raw file structure: data_0raw_*.mat
F: sFile structure, documents completely the continuous raw file, described below.
(for imported epochs, .F contains directly the MEG/EEG recordings [Nchannels x Ntime])Comment: String used to represent the file in the database explorer.
Time: First and last time points recorded in the continuous file.
ChannelFlag: [Nchannels x 1] list of good/bad channels (good=1, bad=-1)
DataType: Type of data stored in this file.
- 'raw' = Link to a continuous raw file
- 'recordings' = Imported epoch
Device: Acquisition system that recorded the dataset.
Events: Not used in the case of links.
nAvg: Number of input files averaged to produce this file.
History: Describes all the operations that were performed with Brainstorm on this file. To get a better view of this piece of information, use the menu File > View file history.
sFile structure: This structure is passed directly to all the input/output functions on continuous files.
filename: Full path to the continuous raw file.
format: Format of the continuous raw file.
device: Acquisition system that recorded the dataset. Same as Link.Device.
condition: Name of the folder in which this file is supposed to be displayed.
comment: Original file comment.
byteorder: Endianness, 'l' = Little Endian, 'b' = Big Endian
prop: Structure, basic properties of the recordings
times: First and last time points recorded in the continuous file.
sfreq: Sampling frequency
nAvg: Number of files that were averaged to produce this file.
currCtfComp: Level of CTF compensation currently applied.
destCtfComp: Level of CTF compensation in which we want to view the file (usually: 3)
epochs: Array of structures used only in the case of continuous recordings saved as "epochs"
events: Array of structures describing the event markers in the file, one structure per event group:
label: Name of the event group
color: [r,g,b] Color used to represent the event group, in Matlab format
epochs: [1 x Nevt] Indicate in which epoch the event is located (index in the sFile.epochs array), or 1 everywhere for files that are not saved in "epoched" mode.
Nevt = number or occurrences of the event = number of markers in this grouptimes: [1 x Nevt] Time in seconds of each marker in this group (times = samples / sfreq).
For extended events: [2 x Nevt], first row = start, second row = endreactTimes: Not used anymore
select: Indicates if the event group should be displayed in the viewer.
channels: {1 x Nevt} Cell array of cell-arrays of strings. Each event occurrence can be associated with one or more channels, by setting .channels{iEvt} to a cell-array of channel names.
notes: {1 x Nevt} Cell-array of strings: additional comments for each event occurrence
header: Structure describing additional header information, depending on the original file format.
channelflag: List of good/bad channels, same information as Link.ChannelFlag.
Useful functions
in_bst_data(DataFile, FieldsList): Read the structure for a data file.
