Tutorial: Process functional NIRS data
|
|
Authors: Thomas Vincent
Prerequisite:
Presentation of the experiment
- Finger tapping task: 10 stimulation blocks of 30 seconds each, with rest periods of ~30 seconds
One subject, one NIRS acquisition run of 12 minutes at 10Hz
- 4 sources and 12 detectors (+ 4 proximity channels) placed above the right motor region
- Two wavelengths: 690nm and 830nm
MRI anatomy 3T from
 scanner type
Extract stimulation events
During the experiment, the stimulation paradigm were run under matlab and sent triggers through the parallel port to the acquistion device. These stimulation events are then stored as a box signal in channel AUX2: values above a certain threshold indicate a stimulation block.
To transform this signal into Brainstorm events, drag and drop the NIRS data "S01_Block_FO_LH_Run01" in the Brainstorm process window. Click on "Run" and select Process "Events -> Detect events above threshold".
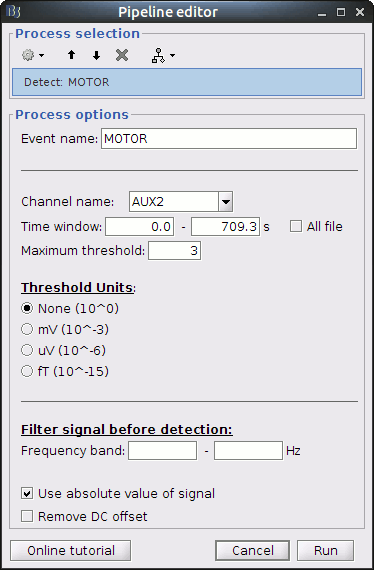
Use the following parameters:
- set "Event name" to "MOTOR"
- select "Channel name": "AUX2"
- set "Maximum threshold" to 3
- Check "Use absolute value of signal"
Then run the process.
To view the results, right-click on "Link to raw file" under "S01_Block_FO_LH_Run01" then "NIRS -> Display time series".
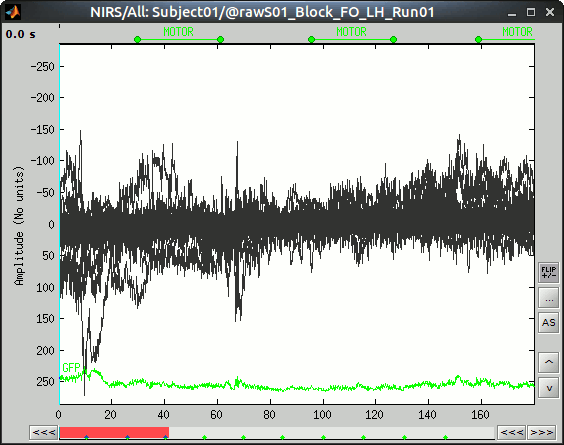
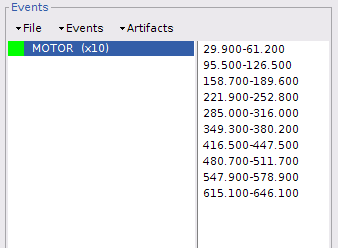
The "MOTOR" event group has been created, by 10 events, each lasting 30 sec. Events are shown in green on the top of the plot.
Bad channel tagging
NIRS measurement are heterogeneous (long distance measurements, movements, occlusion by hair) and the signal in several channels might not be analyzable. A first pre-processing step hence consists in removing those channels.
The following criterions may be applied to reject channels:
- some values are negative
- signal is flat (variance close to 0)
- signal has too many flat segments
Drag and drop the NIRS data "S01_Block_FO_LH_Run01" in the Brainstorm process window. Click on "Run" and select Process "NIRSTORM -> Tag bad channels".
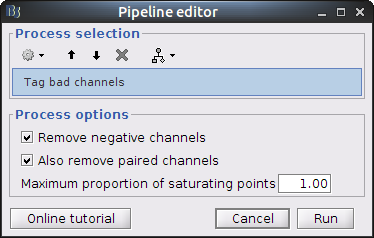
- Remove negative channels: tag a channel as bad if it has a least one negative value. This is important for the quantification of delta [Hb] which cannot be applied if there are negative values.
- Maximum proportion of saturating point: a saturating point has a value equals to the maximum of the signal. The default is at 1: remove only flat signals. If one wants to also keep flat channels, set the value to at least 1.01.
This process is performed "in place": the channel flags of the given data are modified. To view the result, right-click on "S01_Block_FO_LH_Run01 > Link to raw file" then "Good/Bad Channels > View all bad channels" or "Edit good/bad channels".
Compute [Hb] variations - Modified Beer-Lambert Law
This process computes variations of concentration of oxy-hemoglobin (HbO), deoxy-hemoglobin (HbR) and total hemoglobin (HbT) from the measured light intensity time courses at different wavelengths.
Note that the channel definition will differ from the raw data. Previously there was one channel per wavelength, now there will be one channel per Hb type (HbO, HbR or HbT). The total number of channels may change.
For a given pair, the formula used is:
delta_hb = d-1 * eps-1 * -log(I / I_ref) / ppf
where:
delta_hb is the 3 x nb_samples matrix of delta [Hb],
d is the distance between the pair optodes,
eps is the 3 x nb_wavelengths matrix of Hb extinction coefficients,
I is the input light intensity,
I_ref is a reference light intensity,
ppf is the partial light path correction factor.
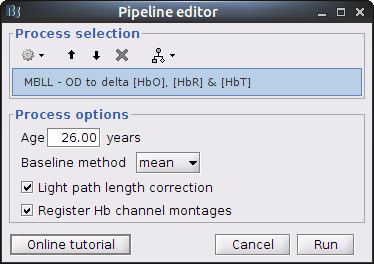
Process parameters:
- Age: age of the subject, used to correct for partial light path length
Baseline method: mean or median. Method to compute the reference intensity (I_ref) against which to compute variations.
Light path length correction: flag to actually correct for light scattering. If unchecked, then ppf=1
Register Hb channel montages: register one montage per paired channel group. This will create a list of montage to help visualizing the different Hb time-courses together.
 make ref to visu
This process creates a new condition, here "Hb_S01_Block_FO_LH_Run01", because the montage is redefined.
Double-click on "Hb_S01_Block_FO_LH_Run01 |- [Hb]" to browse the delta [Hb] time-series.
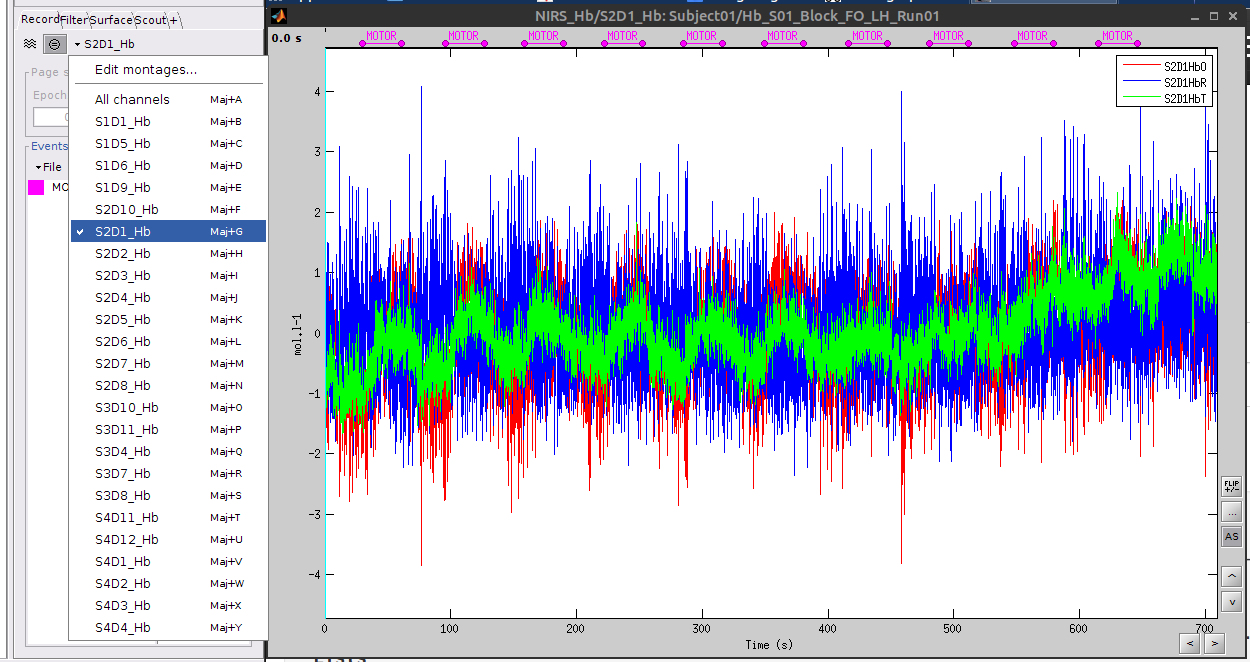
As shown on the left part, all recorded optode pairs are available as montages to enable the display of overlapping HbO, HbR and HbT.
Linear detrend
This filter process removes any linear trend in the signal.
Clear the process window and drag and drop the item named "[Hb]" into it. Select "Run -> NIRSTORM -> Linear Detrend"
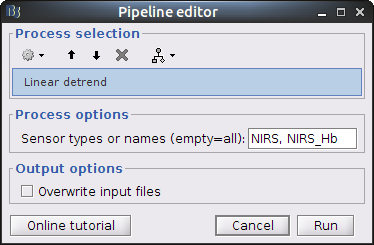
Parameters:
- Sensor types: channel types on which to apply detrending
- Overwrite input files: if unchecked, then create a new file with the detrended signal.
This process creates an item called "[Hb] | detrended"
Infinite Impulse Response filtering
So far, the signal still contains a lot of physiological components of non-interest: heart beats, breathing and Mayer waves. As the evoked signal of interest should be distinct from those components in terms of frequency bands, we can get rid of them by filtering.
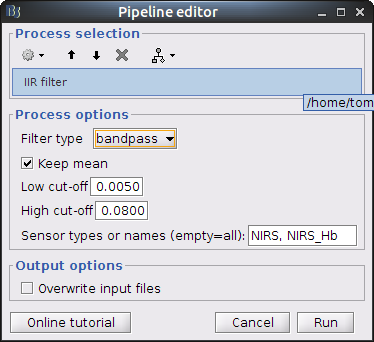
Parameters:
- Filter type: lowpass, highpass, bandpass or bandstop.
- Low cut-off (Hz.): lower bound cut-off frequency for highpass, bandpass and bandstop filters.
- High cut-off (Hz.): higher bound cut-off frequency for lowpass, bandpass and bandstop filters.
- Sensor types: channel types on which to apply filtering
- Overwrite input files: if unchecked, then create a new file with the detrended signal.
This process creates an item called "[Hb] | detrended | IIR filtered"
Window averaging
the goal is to get the response elicited by the motor paradigm. For this, we perform window-averaging time-locked on each motor onset while correcting for baseline differences across trials.
The first step is to split the data into chunks corresponding to the window over which we want to average. The average window is wider than the stimulation events: we'd like to see the return to baseline / undershoot after stimulation. If we directly use the extended MOTOR events to split data, the window will be constrain to the event durations.
To avoid this, define new "simple" events from the existing ones: Double-click on "[Hb] | detrended | IIR filtered", then in the right panel select the MOTOR event type, click on "Events -> convert to simple events" and select "start". Then click on "File -> Save modifications". This defines the temporal origin point of the peri-stimulus averaging window.
Right-click on "[Hb] | detrended | IIR filtered -> Import in database"
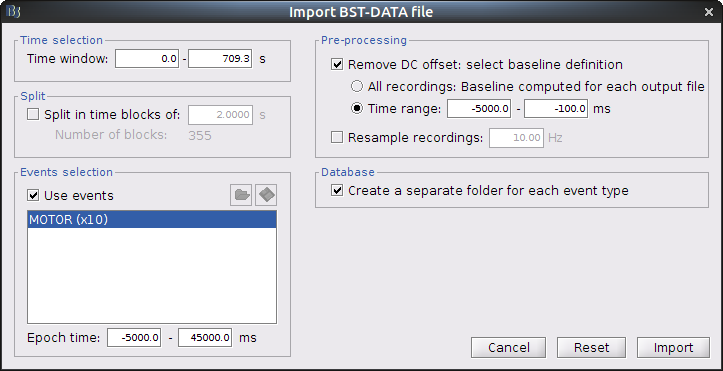
Ensure that "Use events" is checked and that the MOTOR events are selected. The epoch time should be: -5000 to 45000 ms. This means that there will be 5 seconds prior to the stimulation event to check if the signal is steady. There will also be 15 seconds after the stimulation to check the return to baseline / undershoot. In the "Pre-processing" panel, check "Remove DC offset" and use a Time range of -5000 to -100 ms. This will set a reference window prior over which to remove chunk offsets. All signals will be zero-centered according to this window. Finally, ensure that the option "Create a separate folder for each event type" is checked".
After clicking on "import", we end up with 10 "MOTOR" data chuncks.
The last step is to actually compute the average of these chunks. Clear the process panel then drag and drop the item "MOTOR (10 files)" into it. Click on "run" and select the process "Average -> Average files".
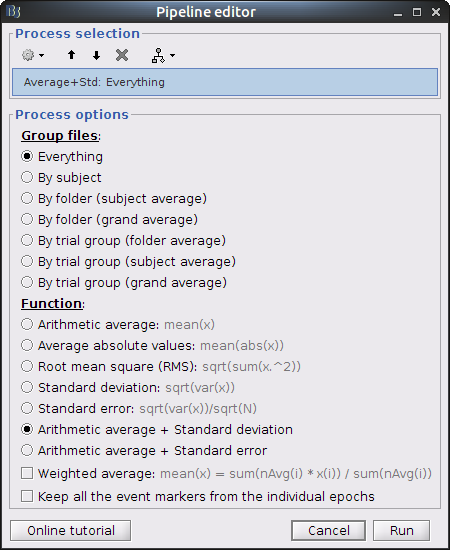
Use Group files: Everything and Function: Arithmetic average + Standard deviation.
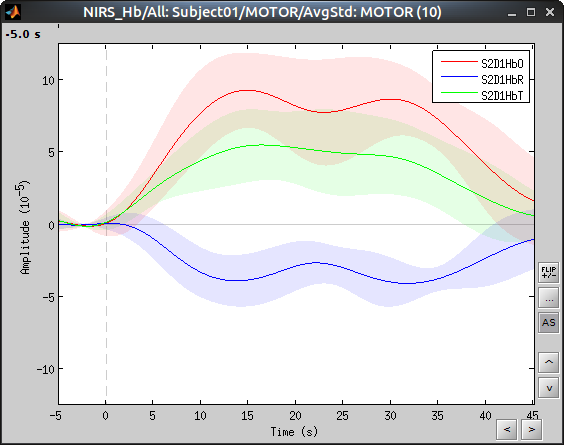
To see the results, double click on the created item "AvgStd: MOTOR (10)". You can again browse by measurement pair by using the different montages in the record panel.
