|
Size: 1135
Comment:
|
Size: 1725
Comment:
|
| Deletions are marked like this. | Additions are marked like this. |
| Line 1: | Line 1: |
| = Tutorial: Import and visualize functional NIRS data = | = Tutorial: Process functional NIRS data = |
| Line 8: | Line 8: |
| Line 18: | Line 19: |
| Line 23: | Line 23: |
| {{attachment:NIRSTORM_tut2_detect_events.gif||height="335"}} | {{attachment:NIRSTORM_tut2_detect_events.gif||height="475"}} Use the following parameters: * set "Event name" to "MOTOR" * select "Channel name": "AUX2" * set "Maximum threshold" to 3 * Check "Use absolute value of signal" Then run the process. To view the results, right-click on "Link to raw file" under "S01_Block_FO_LH_Run01" then "NIRS -> Display time series". {{attachment:NIRSTORM_tut2_nirs_time_series_motor_events.gif||height="350"}} The "MOTOR" event group has been created, by 10 events, each lasting 30 sec. Events are shown in green on the top of the plot. {{attachment:NIRSTORM_tut2_list_motor_events.gif||height="200"}} |
Tutorial: Process functional NIRS data
|
|
Authors: Thomas Vincent, Zhengchen Cai
Prerequisite:
Presentation of the experiment
- Finger tapping task: 10 stimulation blocks of 30 seconds each, with rest periods of ~30 seconds
One subject, one NIRS acquisition run of 12 minutes at 10Hz
- 4 sources and 12 detectors (+ 4 proximity channels) placed above the right motor region
- Two wavelengths: 690nm and 830nm
MRI anatomy 3T from
 scanner type
Extract stimulation events
Stimulation events are stored as a box signal in channel AUX2: values above a certain threshold indicate a stimulation block.
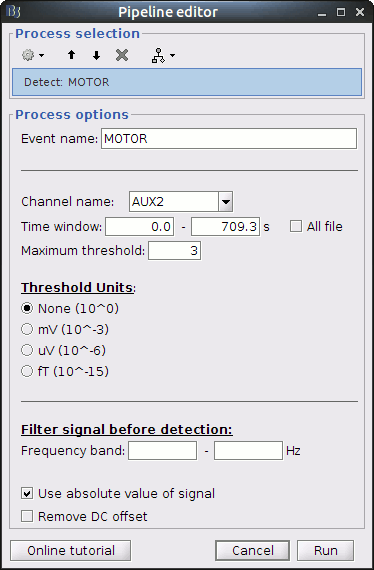
To transform this signal into Brainstorm events, drag and drop the NIRS data "S01_Block_FO_LH_Run01" in the Brainstorm process window. Click on "Run" and select Process "Events -> Detect events above threshold".

Use the following parameters:
- set "Event name" to "MOTOR"
- select "Channel name": "AUX2"
- set "Maximum threshold" to 3
- Check "Use absolute value of signal"
Then run the process.
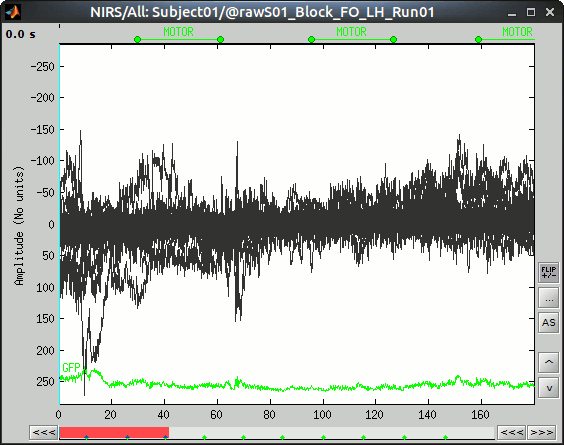
To view the results, right-click on "Link to raw file" under "S01_Block_FO_LH_Run01" then "NIRS -> Display time series".

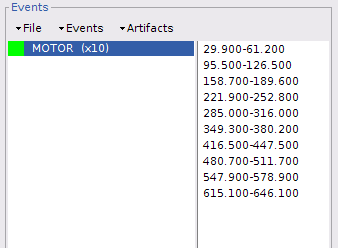
The "MOTOR" event group has been created, by 10 events, each lasting 30 sec. Events are shown in green on the top of the plot.

