Tutorial: Process functional NIRS data
|
|
Authors: Thomas Vincent, Zhengchen Cai
Prerequisite:
Presentation of the experiment
- Finger tapping task: 10 stimulation blocks of 30 seconds each, with rest periods of ~30 seconds
One subject, one NIRS acquisition run of 12 minutes at 10Hz
- 4 sources and 12 detectors (+ 4 proximity channels) placed above the right motor region
- Two wavelengths: 690nm and 830nm
MRI anatomy 3T from
 scanner type
Bad channel tagging
NIRS measurement are heterogeneous (long distance, movements, hair). This process is usually performed on optical density data.
The following criterions may be applied to reject channels:
- some values are negative
- signal is flat (variance close to 0)
- signal has too many flat segments
Extract stimulation events
During the experiment, the stimulation paradigm were run under matlab and sent triggers through the parallel port to the acquistion device. These stimulation events are then stored as a box signal in channel AUX2: values above a certain threshold indicate a stimulation block.
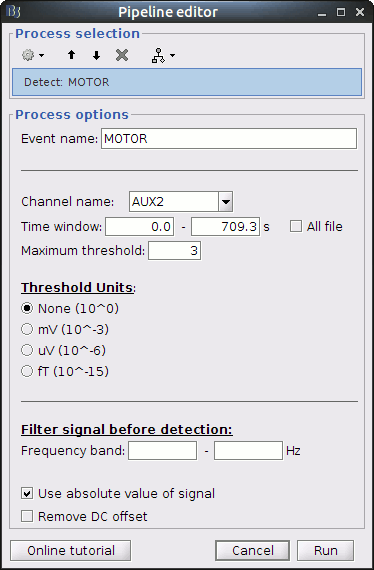
To transform this signal into Brainstorm events, drag and drop the NIRS data "S01_Block_FO_LH_Run01" in the Brainstorm process window. Click on "Run" and select Process "Events -> Detect events above threshold".

Use the following parameters:
- set "Event name" to "MOTOR"
- select "Channel name": "AUX2"
- set "Maximum threshold" to 3
- Check "Use absolute value of signal"
Then run the process.
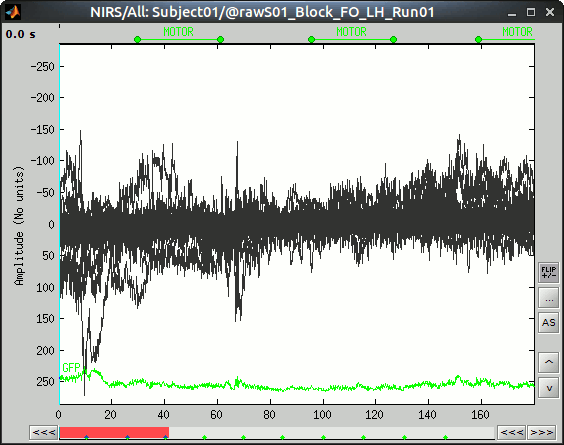
To view the results, right-click on "Link to raw file" under "S01_Block_FO_LH_Run01" then "NIRS -> Display time series".

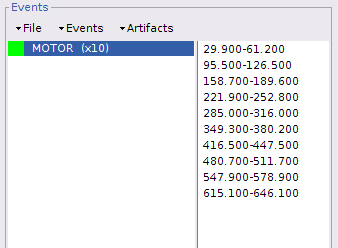
The "MOTOR" event group has been created, by 10 events, each lasting 30 sec. Events are shown in green on the top of the plot.

