|
Size: 17178
Comment:
|
Size: 22869
Comment:
|
| Deletions are marked like this. | Additions are marked like this. |
| Line 1: | Line 1: |
| = Tutorial: Import and visualize functional NIRS data = '''[TUTORIAL UNDER DEVELOPMENT: NOT READY FOR PUBLIC USE] ''' ''Authors: Thomas Vincent'' This tutorial illustrates how to import and process Brainsight NIRS recordings in Brainstorm. <<TableOfContents(2,2)>> |
= Tutorial: NIRS data importation, visualization and response estimate in the optode space = Author: ''Thomas Vincent, PERFORM Centre and physics dpt., Concordia University, Montreal, Canada'' <<BR>> (thomas.vincent at concordia dot ca) Collaborators: * ''Zhengchen Cai, PERFORM Centre and physics dpt., Concordia University, Montreal, Canada'' * ''Alexis Machado, Multimodal Functional Imaging Lab., Biomedical Engineering Dpt, McGill University, Montreal, Canada'' * ''Louis Bherer, Centre de recherche, Institut de Cardiologie de Montréal, Montréal, Canada'' * ''Jean-Marc Lina, Electrical Engineering Dpt, Ecole de Technologie Supérieure, Montréal, Canada'' * ''Christophe Grova, PERFORM Centre and physics dpt., Concordia University, Montreal, Canada'' '''This tutorial illustrates how to import and process NIRS recordings in Brainstorm. ''' '''<<TableOfContents(2,2)>> ''' |
| Line 11: | Line 21: |
| * Finger tapping task: 10 stimulation blocks of 30 seconds each, with rest periods of ~30 seconds * One subject, one run of 12''' '''minutes acquired with a sampling rate of 10Hz * 4 sources and 12 detectors (+ 4 proximity channels) placed above the right motor region * Two wavelengths: 690nm and 830nm * MRI anatomy 3T processed with BrainVISA /!\ '''version ''' |
* '''Finger tapping task: 10 stimulation blocks of 30 seconds each, with rest periods of ~30 seconds ''' * '''One subject, one run of 12''' '''minutes acquired with a sampling rate of 10Hz ''' * '''4 sources and 12 detectors (+ 4 proximity channels) placed above the right motor region ''' * '''Two wavelengths: 690nm and 830nm ''' * '''MRI anatomy 3T processed with BrainVISA ''' |
| Line 18: | Line 28: |
| * '''Requirements''': You have already followed all the introduction tutorials #1-#6 and you have a working copy of Brainstorm installed on your computer. * Go to the [[http://neuroimage.usc.edu/bst/download.php|Download]] page of this website, and download the file: '''sample_nirs.zip''' * Unzip it in a folder that is not in any of the Brainstorm folders (program folder or database folder) * Start Brainstorm (Matlab scripts or stand-alone version) * Select the menu File > Create new protocol. Name it "'''TutorialNIRS'''" and select the options: * "'''No, use individual anatomy'''", * "'''No, use one channel file per acquisition run (MEG/EEG)'''". <<BR>>In term of sensor configuration, NIRS is similar to EEG and the placement of optodes may change between subjects. Also, the channel definition will change during data processing, that's why you should always use one channel file per acquisition run, even if the optode placement does not change. |
* '''Requirements''': You have already followed all the introduction tutorials #1-#6 and you have a working copy of Brainstorm installed on your computer. ''' ''' * the [[https://github.com/Nirstorm/nirstorm|nirstorm plugin]] has been downloaded and installed. See [[https://github.com/Nirstorm/nirstorm#installation|this page]] for instructions on installation. * Go to the [[http://neuroimage.usc.edu/bst/download.php|Download]] page of this website, and download the file: '''sample_nirs.zip''' ''' ''' * Unzip it in a folder that is not in any of the Brainstorm folders (program folder or database folder) ''' ''' * Start Brainstorm (Matlab scripts or stand-alone version) ''' ''' * Select the menu File > Create new protocol. Name it "'''TutorialNIRS'''" and select the options: ''' ''' * "'''No, use individual anatomy'''", ''' ''' * "'''No, use one channel file per acquisition run (MEG/EEG)'''". <<BR>>In term of sensor configuration, NIRS is similar to EEG and the placement of optodes may change between subjects. Also, the channel definition will change during data processing, that's why you should always use one channel file per acquisition run, even if the optode placement does not change. ''' ''' |
| Line 27: | Line 38: |
| * Switch to the "anatomy" view of the protocol. * Right-click on the TutorialNIRS folder > '''New subject''' > Subject01 * Leave the default options you set for the protocol * Right-click on the subject node > '''Import anatomy folder''': * Set the file format: "BrainVISA folder" * Select the folder: '''sample_nirs/anatomy''' * Number of vertices of the cortex surface: 15000 (default value) * Answer "yes" when asked to apply the transformation. * Set the 3 required fiducial points, indicated below in (x,y,z) MRI coordinates. You can right-click o nthe MRI viewer > Edit fiducial points, and copy-paste the coordinates. Click [Save] when done. * NAS: 95 213 114 * LPA: 31 126 88 * RPA: 164 128 89 * AC, PC, IH: These points were already placed in BrainVISA and imported directly. There are not very precisely placed, but this will be good enough for there use in Brainstorm.<<BR>><<BR>> {{attachment:NIRSTORM_tut_nirs_tapping_MRI_edit.gif||height="400"}} * At the end of the process, make sure that the file "cortex_15000V" is selected (downsampled pial surface, that will be used for the source estimation). If it is not, double-click on it to select it as the default cortex surface. * The head and white segmentations provided in the NIRS sample data were computed with Brainvisa and should automatically be imported and processed. You can check the registration between the MRI and the loaded meshes by right-clicking on each mesh > MRI registration > Check MRI/Surface registration". <<BR>><<BR>> {{attachment:NIRSTORM_tut_nirs_tapping_new_MRI_meshes.gif||height="263",width="304"}} |
* Switch to the "anatomy" view of the protocol. ''' ''' * Right-click on the TutorialNIRS folder > '''New subject''' > Subject01 ''' ''' * Leave the default options you set for the protocol ''' ''' * Right-click on the subject node > '''Import anatomy folder''': ''' ''' * Set the file format: "BrainVISA folder" ''' ''' * Select the folder: '''sample_nirs/anatomy''' ''' ''' * Number of vertices of the cortex surface: 15000 (default value) ''' ''' * Answer "yes" when asked to apply the transformation. ''' ''' * Set the 3 required fiducial points, indicated below in (x,y,z) MRI coordinates. You can right-click on the MRI viewer > Edit fiducial positions, and copy-paste the following coordinates in the corresponding fields. Click [Save] when done. ''' ''' * NAS: 95 213 114 ''' ''' * LPA: 31 126 88 ''' ''' * RPA: 164 128 89 ''' ''' * AC, PC, IH: These points were already placed in BrainVISA and imported directly. There are not very precisely placed, but this will be good enough for our usage in Brainstorm.<<BR>><<BR>> {{attachment:NIRSTORM_tut_nirs_tapping_MRI_edit.gif||height="400"}} ''' ''' * Click on save at the bottom right of the window * At the end of the process, make sure that the file "cortex_15000V" is selected (downsampled pial surface, that will be used for the source estimation). If it is not, right-click on it and select "set as default cortex". ''' ''' * The head and white segmentations provided in the NIRS sample data were computed with Brainvisa and should automatically be imported and processed. You can check the registration between the MRI and the loaded meshes by right-clicking on each mesh > MRI registration > Check MRI/Surface registration". <<BR>><<BR>> {{attachment:NIRSTORM_tut_nirs_tapping_new_MRI_meshes.gif||width="304",height="263"}} ''' ''' |
| Line 45: | Line 56: |
| The functional data used in this tutorial was produced by the Brainsight acquisition software and is available in the data subfolder of the nirs sample folder. It contains the following files: * '''fiducials.txt''': the coordinates of the fudicials (nasion, left ear, right ear).<<BR>>The positions of the Nasion, LPA and RPA have been digitized at the same location as the fiducials previously marked on the anatomical MRI. These points will be used by Brainstorm for the registration, hence the consistency between the digitized and marked fiducials is essential for good results. * '''optodes.txt''': the coordinates of the optodes (sources and detectors), in the same referential as in fiducials.txt. Note: the actual referential is not relevant here, as the registration will be performed by Brainstorm afterwards. * '''S01_Block_FO_LH_Run01.nirs''': the NIRS data in a HOMer-based format /!\ '''document format'''.<<BR>>Note: The fields ''SrcPos'' and ''DetPos'' will be overwritten to match the given coordinates in "optodes.txt" To import this dataset in Brainstorm: * Go to the "functional data" view of the protocol. * Right-click on Subject01 > '''Review raw file''' * Select file type '''NIRS: Brainsight (.nirs)''' * Select file '''sample_nirs/data/S01_Block_FO_LH_Run01.nirs''' * Note: the importation process assumes that the files optodes.txt and fiducials.txt are in the same folder as the .nirs data file. |
The functional data used in this tutorial was produced by the Brainsight acquisition software and is available in the data subfolder of the nirs sample folder. It contains the following files: ''' ''' * '''fiducials.txt''': the coordinates of the fudicials (nasion, left ear, right ear).<<BR>>The positions of the Nasion, LPA and RPA have been digitized at the same location as the fiducials previously marked on the anatomical MRI. These points will be used by Brainstorm for the registration, hence the consistency between the digitized and marked fiducials is essential for good results. ''' ''' * '''optodes.txt''': the coordinates of the optodes (sources and detectors), in the same referential as in fiducials.txt. Note: the actual referential is not relevant here, as the registration will be performed by Brainstorm afterwards. ''' ''' * '''S01_Block_FO_LH_Run01.nirs''': the NIRS data in a [[http://www.nmr.mgh.harvard.edu/martinos/software/homer/HOMER2_UsersGuide_121129.pdf|HOMer-based format]].<<BR>>Note: The fields ''SrcPos'' and ''DetPos'' will be overwritten to match the given coordinates in "optodes.txt" ''' ''' To import this dataset in Brainstorm: ''' ''' * Go to the "functional data" view of the protocol. ''' ''' * Right-click on Subject01 > '''Review raw file''' ''' ''' * Select file type '''NIRS: Brainsight (.nirs)''' ''' ''' * Select file '''sample_nirs/data/S01_Block_FO_LH_Run01.nirs''' ''' ''' * Note: the importation process assumes that the files optodes.txt and fiducials.txt are in the same folder as the .nirs data file. ''' ''' |
| Line 60: | Line 71: |
| In the same way as in the tutorial "[[http://neuroimage.usc.edu/brainstorm/Tutorials/ChannelFile|Channel file / MEG-MRI coregistration]]", the registration between the MRI and the NIRS is first based on three reference points Nasion, Left and Right ears. It can then be refined with the either the full head shape of the subject or with manual adjustment. * The initial registration is based on the three fiducial point that define the Subject Coordinate System (SCS): nasion, left ear, right ear. You have marked these three points in the MRI viewer in the [[http://neuroimage.usc.edu/brainstorm/Tutorials/NIRSDataImport#Import_MRI|previous part]]. * These same three points have also been marked before the acquisition of the NIRS recordings. The person who recorded this subject digitized their positions with a tracking device (here Brainsight). The position of these points are saved in the NIRS datasets (see fiducials.txt). * When the NIRS recordings are loaded into the Brainstorm database, they are aligned on the MRI using these fiducial points: the NAS/LPA/RPA points digitized with Brainsight are matched with the ones we placed in the MRI Viewer. To review this registration: * Right-click on NIRS-BRS sensors (104) > Display sensors > '''NIRS cap''' or '''NIRS label''' * The menu "NIRS label" shows additional information: the labels of the optodes and the lines representing the channels of data that were recorded (one channel = one pair source/detector). * To show the fiducials, which were stored as additional digitized head points: <<BR>>Right-click on the 3D figure > Figure > View head points.<<BR>><<BR>> {{attachment:NIRSTORM_tut_nirs_tapping_display_sensors_fiducials.png||height="284",width="352"}} As reference, the following figures show the position of fiducials [blue] (inion and nose tip are extra positions), sources [orange] and detectors [green] as they were digitized by Brainsight: {{attachment:NIRSTORM_tut_nirs_tapping_brainsight_head_mesh_fiducials_1.gif||height="280"}} {{attachment:NIRSTORM_tut_nirs_tapping_brainsight_head_mesh_fiducials_2.gif||height="280"}} {{attachment:NIRSTORM_tut_nirs_tapping_brainsight_head_mesh_fiducials_3.gif||height="280"}} |
In the same way as in the tutorial "[[http://neuroimage.usc.edu/brainstorm/Tutorials/ChannelFile|Channel file / MEG-MRI coregistration]]", the registration between the MRI and the NIRS is first based on three reference points Nasion, Left and Right ears. It can then be refined with the either the full head shape of the subject or with manual adjustment. ''' ''' * The initial registration is based on the three fiducial point that define the Subject Coordinate System (SCS): nasion, left ear, right ear. You have marked these three points in the MRI viewer in the [[http://neuroimage.usc.edu/brainstorm/Tutorials/NIRSDataImport#Import_MRI|previous part]]. ''' ''' * These same three points have also been marked before the acquisition of the NIRS recordings. The person who recorded this subject digitized their positions with a tracking device (here Brainsight). The position of these points are saved in the NIRS datasets (see fiducials.txt). ''' ''' * When the NIRS recordings are loaded into the Brainstorm database, they are aligned on the MRI using these fiducial points: the NAS/LPA/RPA points digitized with Brainsight are matched with the ones we placed in the MRI Viewer. ''' ''' To review this registration: ''' ''' * Right-click on NIRS-BRS sensors (97) > Display sensors > '''NIRS (pairs)'''.This will display sources as red balls and detectors as green balls. Source/detector pairings are displayed as blue lines. * To show the channel labels right-click on the 3D figure > Channels > Display labels. You can also display the middle point of each channel with Channels > Display sensors. * To show the fiducials, which were stored as additional digitized head points: <<BR>>Right-click on the 3D figure > Figure > View head points.<<BR>><<BR>> {{attachment:NIRSTORM_tut_nirs_tapping_display_sensors_fiducials.png||width="352",height="284"}} ''' ''' As reference, the following figures show the position of fiducials [blue] (inion and nose tip are extra positions), sources [orange] and detectors [green] as they were digitized by Brainsight: ''' ''' {{attachment:NIRSTORM_tut_nirs_tapping_brainsight_head_mesh_fiducials_1.gif||height="280"}} {{attachment:NIRSTORM_tut_nirs_tapping_brainsight_head_mesh_fiducials_2.gif||height="280"}} {{attachment:NIRSTORM_tut_nirs_tapping_brainsight_head_mesh_fiducials_3.gif||height="280"}} ''' ''' |
| Line 75: | Line 88: |
| The resulting data organization should be: {{attachment:NIRSTORM_tut_nirs_tapping_func_organization.png}} This indicates that the data comes from the Brainsight system (BRS) and comprises 97 channels (96 NIRS channels + 1 auxiliary signals). To review the content of channels, right-click on the channel file > Edit channel file. {{attachment:NIRSTORM_tut_nirs_tapping_channel_table.png||height="350"}} * Channels whose name is in the form SXDYWLZZZ represent NIRS measurements. For a given NIRS channel, its name is composed of the pair Source X, Detector Y and the wavelength value ZZZ. Column Loc(1) contains the coordinates of the source, Loc(2) the coordinates of the associated detector. * Each NIRS channel is here assigned to the group "WL690" or "WL830" to specified its wavelength. * Channels AUXY of type NIRS_AUX are data read from the nirs.aux structure of the input NIRS data file. It usually contains acquisition triggers (AUX1 here) and stimulation events (AUX2 here). |
The resulting data organization should be: ''' ''' {{attachment:NIRSTORM_tut_nirs_tapping_func_organization.png}} ''' ''' This indicates that the data comes from the Brainsight system (BRS) and comprises 97 channels (96 NIRS channels + 1 auxiliary signals). ''' ''' To review the content of channels, right-click on the channel file > Edit channel file. ''' ''' {{attachment:NIRSTORM_tut_nirs_tapping_channel_table.png||height="350"}} ''' ''' * Channels whose name is in the form SXDYWLZZZ represent NIRS measurements. For a given NIRS channel, its name is composed of the pair Source X, Detector Y and the wavelength value ZZZ. Column Loc(1) contains the coordinates of the source, Loc(2) the coordinates of the associated detector. ''' ''' * Each NIRS channel is here assigned to the group "WL690" or "WL830" to specified its wavelength. ''' ''' * Channels AUXY of type NIRS_AUX are data read from the nirs.aux structure of the input NIRS data file. It usually contains acquisition triggers (AUX1 here) and stimulation events (AUX2 here). ''' ''' |
| Line 90: | Line 103: |
| Select "Subject01/S01_Block_FO_LH_Run01/Link to raw file -> NIRS -> Display time series" It will open a new figure with superimposed channels | Select "Subject01 |- S01_Block_FO_LH_Run01 |- Link to raw file -> NIRS -> Display time series". It will open a new figure with superimposed channels. If DC is enabled, the figure should look like: |
| Line 94: | Line 107: |
| Which can also be viewed in butterfly mode {{attachment:NIRSTORM_tut_nirs_tapping_time_series_butterfly.png||height="400"}} To view the auxiliary data, select "Subject01/S01_Block_FO_LH_Run01/Link to raw file -> NIRS_AUX -> Display time series" {{attachment:NIRSTORM_tut_nirs_tapping_time_series_AUX_stacked.gif||height="300"}} We refer to the tutorial for navigating in these views [[Tutorials/ReviewRaw|"Review continuous recordings"]] === Montage selection === /!\ TODO add dynamic montages /!\ Add screenshot |
The default temporal window may be limited to a couple a seconds. To actually see the whole time series, in the main brainstorm window -- right panel, go to the "Record" tab, and change "Start" to 0 and "Duration:" to 709.3s (you can see the total duration at the top right of the brainstorm main window). If coloring is not visible, right-click on the figure the select "Montage > NIRS Overlay > NIRS Overlay" Indeed, brainstorm uses a dynamical montage, called ''NIRS Overlay,'' to regroup and color-code nirs time-series depending on the wavelength (red: 830nm, green:686nm). The signals for a given pair of source and detectors are also grouped when using the selection tool. So clicking one curve for one wavelength will also select the other wavelength for the same pair. To isolate the signals of a selected pair, the default behaviour of brainstorm can be used by pressing ENTER or right-click on the figure then "Channel > View selected". However, the NIRS overlay dynamic montage is not activated in this case (will be fixed in the future). |
| Line 110: | Line 114: |
| During the experiment, the stimulation paradigm was run under matlab and sent triggers through the parallel port to the acquisition device. These stimulation events are then stored as a box signal in channel AUX2: values above a certain threshold indicate a stimulation block. To transform this signal into Brainstorm events, drag and drop the NIRS data "S01_Block_FO_LH_Run01" in the Brainstorm process window. Click on "Run" and select Process "Events -> Read from channel". {{attachment:NIRSTORM_tut_nirs_tapping_detect_events.gif||width="300"}} Use the following parameters: * set "Event channels" to "NIRS_AUX" * select "TTL: detect peaks ...". This is the method to extract events from the AUX signal. |
During the experiment, the stimulation paradigm was run under matlab and sent triggers through the parallel port to the acquisition device. These stimulation events are then stored as a box signal in channel AUX1: values above a certain threshold indicate a stimulation block. To view the auxiliary data, select "Subject01 |- S01_Block_FO_LH_Run01 |- Link to raw file -> NIRS_AUX -> Display time series" {{attachment:NIRSTORM_tut_nirs_tapping_time_series_AUX_stacked.gif||height="300"}} ''' ''' To transform this signal into Brainstorm events, drag and drop the NIRS data "S01_Block_FO_LH_Run01 |- Link to raw file" in the Brainstorm process window. Click on "Run" and select Process "Events -> Read from channel". ''' ''' {{attachment:NIRSTORM_tut_nirs_tapping_detect_events.gif||width="300"}} ''' ''' Use the following parameters: ''' ''' * set "Event channels" to "NIRS_AUX" ''' ''' * select "TTL: detect peaks ...". This is the method to extract events from the AUX signal. ''' ''' |
| Line 123: | Line 131: |
| Then right-click on "Link to raw file" under "S01_Block_FO_LH_Run01" then "NIRS -> Display time series". There should be an event group called "AUX1". Rename it to "MOTOR" using "Events -> Rename Group". {{attachment:NIRSTORM_tut_nirs_tapping_nirs_time_series_motor_events.gif||height="300"}} The "MOTOR" event group has 10 events which are shown in green on the top of the plot. |
Then right-click on "Link to raw file" under "S01_Block_FO_LH_Run01" then "NIRS -> Display time series". The panel on the left shows the events, where there should be an event group called "AUX1". In the top menu "Events", select "Rename Group", and rename it to "MOTOR". {{attachment:NIRSTORM_tut_nirs_tapping_nirs_time_series_motor_events.gif||height="300"}} ''' ''' The "MOTOR" event group has 10 events which are shown in green on the top of the plot. ''' ''' == Movement correction == In fNIRS data, a movement usually induces a spiked signal variation and shifts the signal baseline. A movement artefact spreads to all channels as the whole head or several scalp muscles are moving. The correction process available is semi-atomatic as it requires the user to tag the movement events. The method used to correct movement is based on [[http://www.ncbi.nlm.nih.gov/pubmed/20308772|spline interpolation]]. ''' ''' To tag specific events (see [[http://neuroimage.usc.edu/brainstorm/Tutorials/EventMarkers|this tutorial]] for a complete presentation of event marking), double-click on "Link to raw file" under "S01_Block_FO_LH_Run01" then in the "Events" menu, select "Add group" and enter "NIRS_mvt". ''' ''' On the time-series, we can identify 3 obvious movement events, highlighted in blue here: ''' ''' {{attachment:NIRSTORM_tut_nirs_tapping_mvts_preview.png||height="240"}} ''' ''' Use shift-left-click to position the temporal marker at the beginning of the movement. Then use the middle mouse wheel to zoom on it and use shift-left-click again to precisely adjust the position of the start of the movement event. Drag until the end of the movement event and use CTRL+E to mark the event. ''' ''' {{attachment:NIRSTORM_tut_nirs_tapping_mvt_marking.png||height="240"}} ''' ''' Repeat the operation for all 3 movement events. You should end up with the following event definitions: ''' ''' {{attachment:NIRSTORM_tut_nirs_tapping_mvts_events.png||width="250"}} ''' ''' After saving and closing all graphic windows, drag and drop "Link to raw file" into the process field and press "Run". In the process menu, select "NIRS > Motion correction". ''' ''' In the process option window, set "Movement event name" to "NIRS_mvt" then click "Run". To check the result, open the obtained time-series "S01_Block_FO_LH_Run01 |- Motion-corrected NIRS" along with the raw one and zoom at the end of the time-series (shift+left-click then mouse wheel): ''' ''' {{attachment:NIRSTORM_tut_nirs_tapping_mvt_corr_result.png||height="240"}} ''' ''' As we can see, the two last movement artefacts are well corrected but the first one is not. This highlights the fact that the motion correction method corrects for rather smooth variations in the signal and spiking events (very rapid movement) are not filtered. However, this is not troubling as spiking artefacts should be filtered out during bandpass filtering. ''' ''' Note that marked movement events are removed in the resulting data set. ''' ''' |
| Line 130: | Line 169: |
| NIRS measurement are heterogeneous (long distance measurements, movements, occlusion by hair) and the signal in several channels might not be properly analysed. A first pre-processing step hence consists in removing those channels. The following criterions may be applied to reject channels: * some values are negative * signal is flat (variance close to 0) * signal has too many flat segments Drag and drop the NIRS data "S01_Block_FO_LH_Run01" in the Brainstorm process window. Click on "Run" and select Process "NIRSTORM -> Tag bad channels". {{attachment:NIRSTORM_tut_nirs_tapping_remove_bad_channels.png||width="300"}} * Remove negative channels: tag a channel as bad if it has a least one negative value. This is important for the quantification of delta [Hb] which cannot be applied if there are negative values. * Maximum proportion of saturating point: a saturating point has a value equals to the maximum of the signal. The default is at 1: remove only flat signals. If one wants to also keep flat channels, set the value to at least 1.01. This process is performed "in place": the channel flags of the given data are modified. To view the result, right-click on "S01_Block_FO_LH_Run01 > Link to raw file" then "Good/Bad Channels > View all bad channels" or "Edit good/bad channels". |
NIRS measurement are heterogeneous (long distance measurements, movements, occlusion by hair) and the signal in several channels might not be properly analysed. A first pre-processing step hence consists in removing those channels. ''' ''' The following criterions may be applied to reject channels: ''' ''' * some values are negative ''' ''' * signal is flat (variance close to 0) ''' ''' * signal has too many flat segments ''' ''' Clear the Brainstorm process panel and drag and drop the NIRS data "S01_Block_FO_LH_Run01 |- Motion-corrected NIRS" in it. Click on "Run" and select Process "NIRS -> Detect bad channels". ''' ''' {{attachment:NIRSTORM_tut_nirs_tapping_remove_bad_channels.png||width="300"}} ''' ''' * Remove negative channels: tag a channel as bad if it has a least one negative value. This is important for the quantification of delta [Hb] which cannot be applied if there are negative values. ''' ''' * Maximum proportion of saturating point: a saturating point has a value equals to the maximum of the signal. The default is at 1: remove only flat signals. If one wants to also keep flat channels, set the value to at least 1.01. ''' ''' This process is performed "in place": the channel flags of the given data are modified. To view the result, right-click on "S01_Block_FO_LH_Run01 |- Motion-corrected NIRS" then "Good/Bad Channels > View all bad channels" or "Edit good/bad channels". ''' ''' |
| Line 148: | Line 187: |
| This process computes variations of concentration of oxy-hemoglobin (HbO), deoxy-hemoglobin (HbR) and total hemoglobin (HbT) from the measured light intensity time courses at different wavelengths. Note that the channel definition will differ from the raw data. Previously there was one channel per wavelength, now there will be one channel per Hb type (HbO, HbR or HbT). The total number of channels may change. For a given pair, the formula used is: . delta_hb = d^-1^ * eps^-1^ * -log(I / I_ref) / ppf where: * '''delta_hb''' is the 3 x nb_samples matrix of delta [Hb], * '''d''' is the distance between the pair optodes, * '''eps''' is the 3 x nb_wavelengths matrix of Hb extinction coefficients, * '''I''' is the input light intensity, * '''I_ref''' is a reference light intensity, * '''ppf''' is the partial light path correction factor. {{attachment:NIRSTORM_tut_nirs_tapping_MBLL.png||width="300"}} Process parameters: * Age: age of the subject, used to correct for partial light path length * Baseline method: mean or median. Method to compute the reference intensity ('''I_ref''') against which to compute variations. * Light path length correction: flag to actually correct for light scattering. If unchecked, then '''ppf'''=1 This process creates a new condition, here "S01_Block_FO_LH_Run01_Hb", because the montage is redefined. Under "S01_Block_FO_LH_Run01_Hb", double-click on "Hb" to browse the delta [Hb] time-series. /!\ TODO: make new snapshot with dynamic montages {{attachment:NIRSTORM_tut_nirs_tapping_view_hb.png||height="240"}} As shown on the left part, all recorded optode pairs are available as montages to enable the display of overlapping HbO, HbR and HbT. /!\ TODO: Adapt to use dynamic montage |
This process computes variations of concentration of oxy-hemoglobin (HbO), deoxy-hemoglobin (HbR) and total hemoglobin (HbT) from the measured light intensity time courses at different wavelengths. ''' ''' Note that the channel definition will differ from the raw data. Previously there was one channel per wavelength, now there will be one channel per Hb type (HbO, HbR or HbT). The total number of channels may change. ''' ''' For a given pair, the formula used is: ''' ''' . delta_hb = d^-1^ * eps^-1^ * -log(I / I_ref) / (dpf/pvf) ''' ''' where: ''' ''' * '''delta_hb''' is the 3 x nb_samples matrix of delta [Hb], ''' ''' * '''d''' is the distance between the pair optodes, ''' ''' * '''eps''' is the 3 x nb_wavelengths matrix of Hb extinction coefficients, ''' ''' * '''I''' is the input light intensity, ''' ''' * '''I_ref''' is a reference light intensity, ''' ''' * '''dpf''' is the differential light path correction factor. Computed as: y0 + a1 * age^a2, where y0, a1 and a2 are constants from [Duncan et al 1996] and age is the participant's age''' ''' * '''pvf''' is the partial volume correction factor. {{attachment:NIRSTORM_tut_nirs_tapping_MBLL.png||width="300"}} ''' ''' Make sure the item "S01_Block_FO_LH_Run01 |- Motion-corrected NIRS" is in the Brainstorm process panel. Then select Run and "NIRS > MBLL - OD to delta [HbO], [HbR] & [HbT]". Process parameters: ''' ''' * Age: age of the subject, used to correct for partial light path length ''' ''' * Baseline method: mean or median. Method to compute the reference intensity ('''I_ref''') against which to compute variations. ''' ''' * PVF: partial volume factor * Light path correction: flag to actually correct for light scattering. If unchecked, then '''dpf/pvf''' is set to 1. This process creates a new condition folder, here "S01_Block_FO_LH_Run01_Hb", because the montage is redefined. ''' ''' Under "S01_Block_FO_LH_Run01_Hb", double-click on "Hb [Topo]" to browse the delta [Hb] time-series. ''' ''' {{attachment:NIRSTORM_tut_nirs_tapping_view_hb.png||height="240"}} ''' ''' |
| Line 182: | Line 221: |
| This filter process removes any linear trend in the signal. Clear the process window and drag and drop the item named "[Hb]" into it. Click on "Run" then select "Pre-process -> Remove linear trend" {{attachment:NIRSTORM_tut_nirs_tapping_detrend_parameters.png||height="240"}} Parameters: * Trend estimation: check "All file" * Sensor types: NIRS. Limit the detrending to actual NIRS measurements (do not treat AUX) This process creates an item called "Hb | detrend" |
This filter process removes any linear trend in the signal. ''' ''' Clear the process window and drag and drop the item "S01_Block_FO_LH_Run01_Hb |- Hb [Topo]" into it. Click on "Run" then select "Pre-process -> Remove linear trend" ''' ''' {{attachment:NIRSTORM_tut_nirs_tapping_detrend_parameters.png||height="240"}} ''' ''' Parameters: ''' ''' * Trend estimation: check "All file" ''' ''' * Sensor types: NIRS. Limit the detrending to actual NIRS measurements (do not treat AUX) ''' ''' This process creates an item called "Hb | detrend" ''' ''' |
| Line 196: | Line 235: |
| So far, the signal still contains a lot of physiological components of non-interest: heart beats, breathing and Mayer waves. As the evoked signal of interest should be distinct from those components in terms of frequency bands, we can get rid of them by filtering. {{attachment:NIRSTORM_tut_nirs_tapping_iir_filter_parameters.png||width="300"}} Parameters: * Filter type: lowpass, highpass, bandpass or bandstop. /!\ add all types * Low cut-off (Hz.): lower bound cut-off frequency for highpass, bandpass and bandstop filters. * High cut-off (Hz.): higher bound cut-off frequency for lowpass, bandpass and bandstop filters. * Sensor types: NRIS. Channel types on which to apply filtering. * Overwrite input files: if unchecked, then create a new file with the detrended signal. This process creates an item called "[Hb] | detrend | IIR filtered" |
So far, signals still contain a lot of physiological components of non-interest: heart beats, breathing and Mayer waves. As the evoked signal of interest should be distinct from those components in terms of frequency bands, we can get rid of them by filtering. ''' ''' Make sure the item "S01_Block_FO_LH_Run01_Hb |-> Hb [Topo] | detrend" is in the Brainstorm process panel. Then select Run and "Pre-process > Band-pass filter". {{attachment:NIRSTORM_tut_nirs_tapping_iir_filter_parameters.png||width="300"}} ''' ''' Parameters: ''' ''' * Sensor types: NIRS. Channel types on which to apply filtering. * Low cut-off: 0.005 Hz. (lower bound cut-off frequency) * High cut-off: 0.08 Hz. (higher bound cut-off frequency) * Stopband attenuation (Hz.): 40dB * Overwrite input files: if unchecked, then create a new file with the filtered signal. This process creates an item called "Hb [Topo] | detrend | band(0.005-0.08Hz)" ''' ''' Here is the resulting filtered Hb data: {{attachment:NIRSTORM_tut_nirs_tapping_iir_filter_result.png||width="450"}} |
| Line 212: | Line 257: |
| the goal is to get the response elicited by the motor paradigm. For this, we perform window-averaging time-locked on each motor onset while correcting for baseline differences across trials. The first step is to split the data into chunks corresponding to the window over which we want to average. The average window is wider than the stimulation events: we'd like to see the return to baseline / undershoot after stimulation. If we directly use the ''extended'' MOTOR events to split data, the window will be constrain to the event durations. To avoid this, define new "simple" events from the existing ones: Double-click on "Hb | detrend | IIR filtered", then in the right panel select the MOTOR event type, click on "Events -> convert to simple events" and select "start". Then click on "File -> Save modifications". This defines the temporal origin point of the peri-stimulus averaging window. Right-click on "Hb | detrend | IIR filtered -> Import in database" {{attachment:NIRSTORM_tut_nirs_tapping_import_data_chunks.png||width="550"}} Ensure that "Use events" is checked and that the MOTOR events are selected. The epoch time should be: -5000 to 55000 ms. This means that there will be 5 seconds prior to the stimulation event to check if the signal is steady. There will also be 25 seconds after the stimulation to check the return to baseline / undershoot. In the "Pre-processing" panel, check "Remove DC offset" and use a Time range of -5000 to -100 ms. This will set a reference window prior over which to remove chunk offsets. All signals will be zero-centered according to this window. Finally, ensure that the option "Create a separate folder for each event type" is checked". After clicking on "import", we end up with 10 "MOTOR" data chunks. The last step is to actually compute the average of these chunks. Clear the process panel then drag and drop the item "MOTOR (10 files)" into it. Click on "run" and select the process "Average -> Average files". {{attachment:NIRSTORM_tut_nirs_tapping_average_files_process.png||width="300"}} Use '''Group files''': Everything and '''Function''': Arithmetic average + Standard deviation. To see the results, double click on the created item "AvgStd: MOTOR (10)". You can again browse by measurement pair by using the different montages in the record panel. {{attachment:NIRSTORM_tut_nirs_tapping_averaged_response.png||width="300"}} |
the goal is to get the response elicited by the motor paradigm. For this, we perform window-averaging time-locked on each motor onset while correcting for baseline differences across trials. ''' ''' The first step is to split the data into chunks corresponding to the window over which we want to average. The average window is wider than the stimulation events: we'd like to see the return to baseline / undershoot after stimulation. Right-click on "Hb [Topo] | detrend | IIR filtered -> Import in database" ''' ''' {{attachment:NIRSTORM_tut_nirs_tapping_import_data_chunks.png||width="550"}} ''' ''' Ensure that "Use events" is checked and that the MOTOR events are selected. The epoch time should be: -5000 to 55000 ms. This means that there will be 5 seconds prior to the stimulation event to check if the signal is steady. There will also be 25 seconds after the stimulation to check the return to baseline / undershoot. In the "Pre-processing" panel, check "Remove DC offset" and use a Time range of -5000 to -100 ms. This will set a reference window prior over which to remove chunk offsets. All signals will be zero-centered according to this window. Finally, ensure that the option "Create a separate folder for each event type" is unchecked". ''' ''' After clicking on "import", we end up with 10 "MOTOR" data chunks. ''' ''' The last step is to actually compute the average of these chunks. Clear the process panel then drag and drop the item "MOTOR (10 files)" into it. Click on "run" and select the process "Average -> Average files". ''' ''' {{attachment:NIRSTORM_tut_nirs_tapping_average_files_process.png||width="300"}} ''' ''' Use '''Group files''': Everything and '''Function''': Arithmetic average + Standard deviation. ''' ''' To see the results, double click on the created item "AvgStd: MOTOR (10)". To view the values mapped on the channels, right-click on the curve figure and select "View topography". Views are temporally synchronized, so shift-clicking on the curve figure at a specific time position will update the topography view with the channel values at that instant. {{attachment:NIRSTORM_tut_nirs_tapping_averaged_response.png||height="250"}} ''' ''' By default, delta [HbO] is displayed in the topography. This can be changed by right-clicking on the 3D view and selecting "Montage > HbR" or "Montage > HbT". |
Tutorial: NIRS data importation, visualization and response estimate in the optode space
Author: Thomas Vincent, PERFORM Centre and physics dpt., Concordia University, Montreal, Canada
(thomas.vincent at concordia dot ca)
Collaborators:
Zhengchen Cai, PERFORM Centre and physics dpt., Concordia University, Montreal, Canada
Alexis Machado, Multimodal Functional Imaging Lab., Biomedical Engineering Dpt, McGill University, Montreal, Canada
Louis Bherer, Centre de recherche, Institut de Cardiologie de Montréal, Montréal, Canada
Jean-Marc Lina, Electrical Engineering Dpt, Ecole de Technologie Supérieure, Montréal, Canada
Christophe Grova, PERFORM Centre and physics dpt., Concordia University, Montreal, Canada
This tutorial illustrates how to import and process NIRS recordings in Brainstorm.
Contents
Presentation of the experiment
Finger tapping task: 10 stimulation blocks of 30 seconds each, with rest periods of ~30 seconds
One subject, one run of 12 minutes acquired with a sampling rate of 10Hz
4 sources and 12 detectors (+ 4 proximity channels) placed above the right motor region
Two wavelengths: 690nm and 830nm
MRI anatomy 3T processed with BrainVISA
Download and installation
Requirements: You have already followed all the introduction tutorials #1-#6 and you have a working copy of Brainstorm installed on your computer.
the nirstorm plugin has been downloaded and installed. See this page for instructions on installation.
Go to the Download page of this website, and download the file: sample_nirs.zip
Unzip it in a folder that is not in any of the Brainstorm folders (program folder or database folder)
Start Brainstorm (Matlab scripts or stand-alone version)
Select the menu File > Create new protocol. Name it "TutorialNIRS" and select the options:
"No, use individual anatomy",
"No, use one channel file per acquisition run (MEG/EEG)".
In term of sensor configuration, NIRS is similar to EEG and the placement of optodes may change between subjects. Also, the channel definition will change during data processing, that's why you should always use one channel file per acquisition run, even if the optode placement does not change.
Import anatomy
Switch to the "anatomy" view of the protocol.
Right-click on the TutorialNIRS folder > New subject > Subject01
Leave the default options you set for the protocol
Right-click on the subject node > Import anatomy folder:
Set the file format: "BrainVISA folder"
Select the folder: sample_nirs/anatomy
Number of vertices of the cortex surface: 15000 (default value)
Answer "yes" when asked to apply the transformation.
Set the 3 required fiducial points, indicated below in (x,y,z) MRI coordinates. You can right-click on the MRI viewer > Edit fiducial positions, and copy-paste the following coordinates in the corresponding fields. Click [Save] when done.
NAS: 95 213 114
LPA: 31 126 88
RPA: 164 128 89
AC, PC, IH: These points were already placed in BrainVISA and imported directly. There are not very precisely placed, but this will be good enough for our usage in Brainstorm.
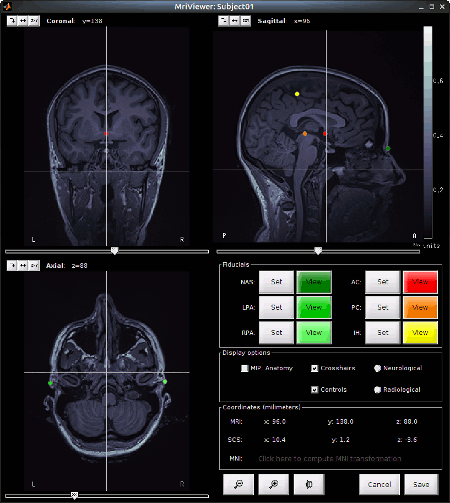
- Click on save at the bottom right of the window
At the end of the process, make sure that the file "cortex_15000V" is selected (downsampled pial surface, that will be used for the source estimation). If it is not, right-click on it and select "set as default cortex".
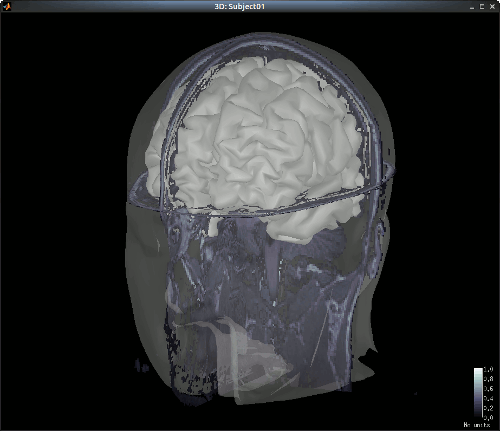
The head and white segmentations provided in the NIRS sample data were computed with Brainvisa and should automatically be imported and processed. You can check the registration between the MRI and the loaded meshes by right-clicking on each mesh > MRI registration > Check MRI/Surface registration".
Import NIRS functional data
The functional data used in this tutorial was produced by the Brainsight acquisition software and is available in the data subfolder of the nirs sample folder. It contains the following files:
fiducials.txt: the coordinates of the fudicials (nasion, left ear, right ear).
The positions of the Nasion, LPA and RPA have been digitized at the same location as the fiducials previously marked on the anatomical MRI. These points will be used by Brainstorm for the registration, hence the consistency between the digitized and marked fiducials is essential for good results.optodes.txt: the coordinates of the optodes (sources and detectors), in the same referential as in fiducials.txt. Note: the actual referential is not relevant here, as the registration will be performed by Brainstorm afterwards.
S01_Block_FO_LH_Run01.nirs: the NIRS data in a HOMer-based format.
Note: The fields SrcPos and DetPos will be overwritten to match the given coordinates in "optodes.txt"
To import this dataset in Brainstorm:
Go to the "functional data" view of the protocol.
Right-click on Subject01 > Review raw file
Select file type NIRS: Brainsight (.nirs)
Select file sample_nirs/data/S01_Block_FO_LH_Run01.nirs
Note: the importation process assumes that the files optodes.txt and fiducials.txt are in the same folder as the .nirs data file.
Registration
In the same way as in the tutorial "Channel file / MEG-MRI coregistration", the registration between the MRI and the NIRS is first based on three reference points Nasion, Left and Right ears. It can then be refined with the either the full head shape of the subject or with manual adjustment.
The initial registration is based on the three fiducial point that define the Subject Coordinate System (SCS): nasion, left ear, right ear. You have marked these three points in the MRI viewer in the previous part.
These same three points have also been marked before the acquisition of the NIRS recordings. The person who recorded this subject digitized their positions with a tracking device (here Brainsight). The position of these points are saved in the NIRS datasets (see fiducials.txt).
When the NIRS recordings are loaded into the Brainstorm database, they are aligned on the MRI using these fiducial points: the NAS/LPA/RPA points digitized with Brainsight are matched with the ones we placed in the MRI Viewer.
To review this registration:
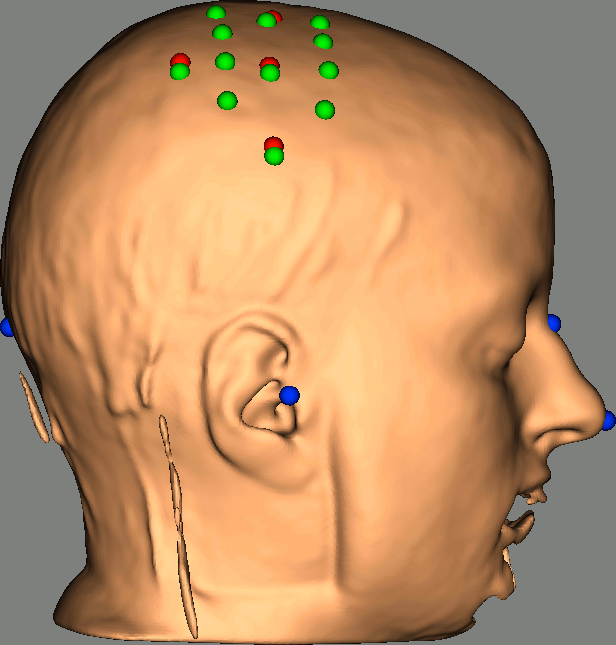
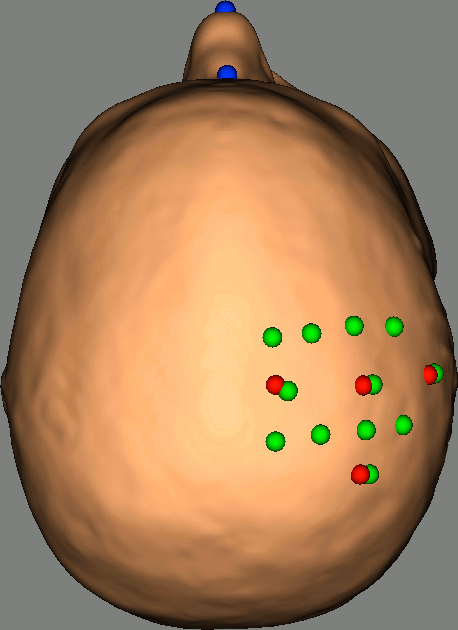
Right-click on NIRS-BRS sensors (97) > Display sensors > NIRS (pairs).This will display sources as red balls and detectors as green balls. Source/detector pairings are displayed as blue lines.
To show the channel labels right-click on the 3D figure > Channels > Display labels. You can also display the middle point of each channel with Channels > Display sensors.
To show the fiducials, which were stored as additional digitized head points:
Right-click on the 3D figure > Figure > View head points.
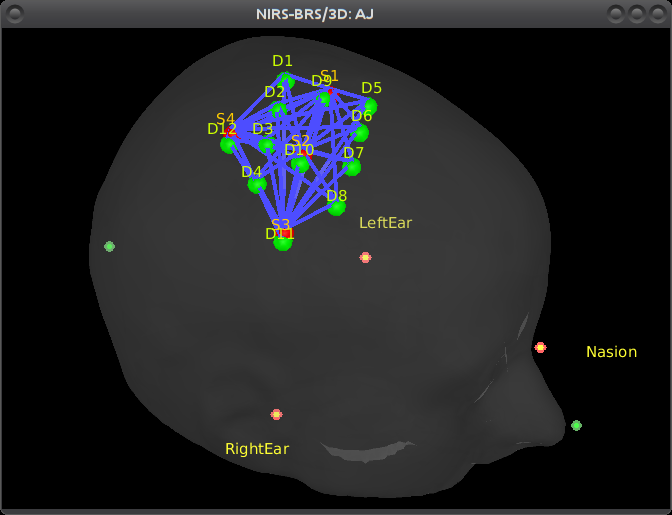
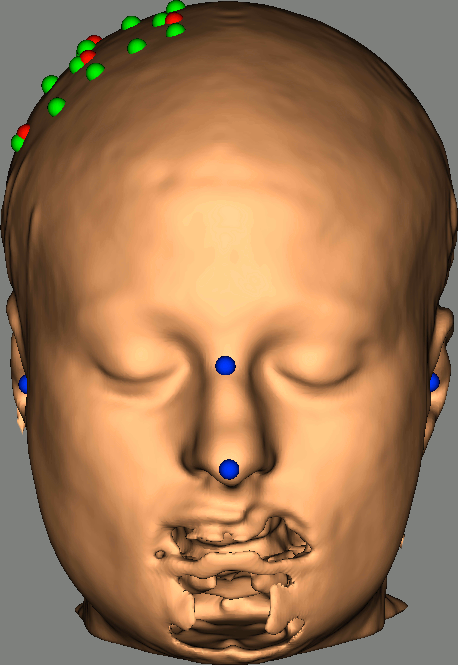
As reference, the following figures show the position of fiducials [blue] (inion and nose tip are extra positions), sources [orange] and detectors [green] as they were digitized by Brainsight:
Review Channel information
The resulting data organization should be:
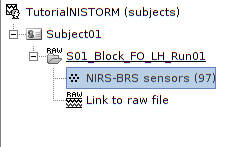
This indicates that the data comes from the Brainsight system (BRS) and comprises 97 channels (96 NIRS channels + 1 auxiliary signals).
To review the content of channels, right-click on the channel file > Edit channel file.
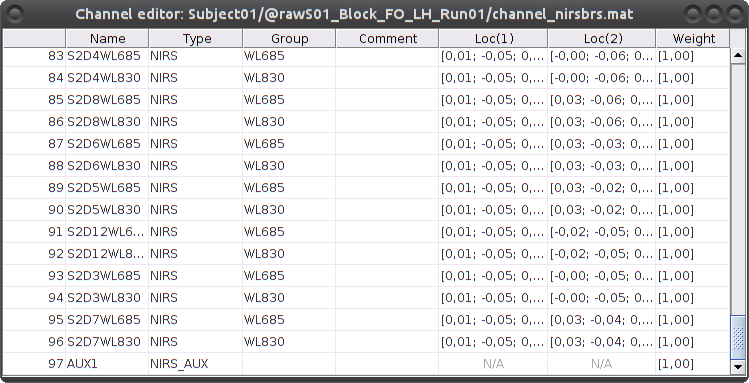
Channels whose name is in the form SXDYWLZZZ represent NIRS measurements. For a given NIRS channel, its name is composed of the pair Source X, Detector Y and the wavelength value ZZZ. Column Loc(1) contains the coordinates of the source, Loc(2) the coordinates of the associated detector.
Each NIRS channel is here assigned to the group "WL690" or "WL830" to specified its wavelength.
Channels AUXY of type NIRS_AUX are data read from the nirs.aux structure of the input NIRS data file. It usually contains acquisition triggers (AUX1 here) and stimulation events (AUX2 here).
Visualize NIRS signals
Select "Subject01 |- S01_Block_FO_LH_Run01 |- Link to raw file -> NIRS -> Display time series". It will open a new figure with superimposed channels. If DC is enabled, the figure should look like:
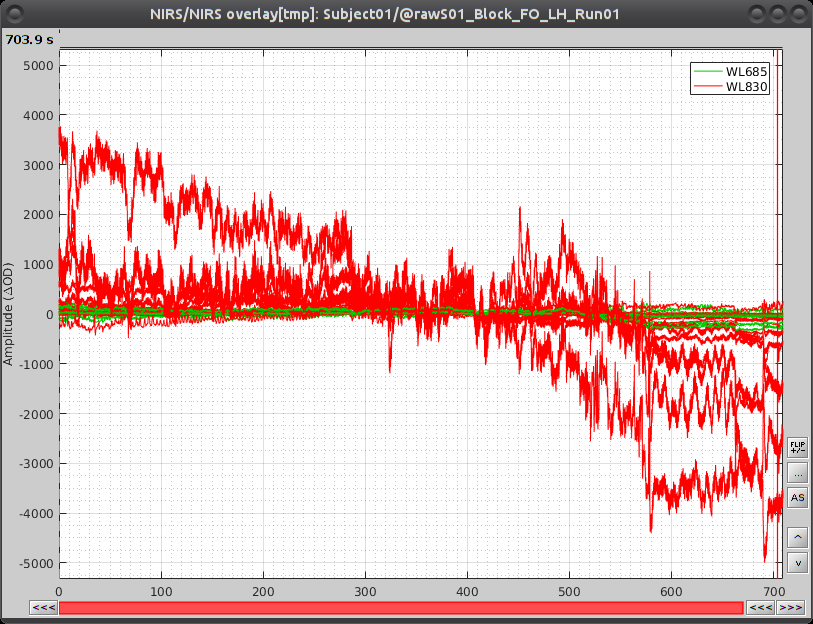
The default temporal window may be limited to a couple a seconds. To actually see the whole time series, in the main brainstorm window -- right panel, go to the "Record" tab, and change "Start" to 0 and "Duration:" to 709.3s (you can see the total duration at the top right of the brainstorm main window).
If coloring is not visible, right-click on the figure the select "Montage > NIRS Overlay > NIRS Overlay" Indeed, brainstorm uses a dynamical montage, called NIRS Overlay, to regroup and color-code nirs time-series depending on the wavelength (red: 830nm, green:686nm). The signals for a given pair of source and detectors are also grouped when using the selection tool. So clicking one curve for one wavelength will also select the other wavelength for the same pair.
To isolate the signals of a selected pair, the default behaviour of brainstorm can be used by pressing ENTER or right-click on the figure then "Channel > View selected". However, the NIRS overlay dynamic montage is not activated in this case (will be fixed in the future).
Extract stimulation events
During the experiment, the stimulation paradigm was run under matlab and sent triggers through the parallel port to the acquisition device. These stimulation events are then stored as a box signal in channel AUX1: values above a certain threshold indicate a stimulation block.
To view the auxiliary data, select "Subject01 |- S01_Block_FO_LH_Run01 |- Link to raw file -> NIRS_AUX -> Display time series"
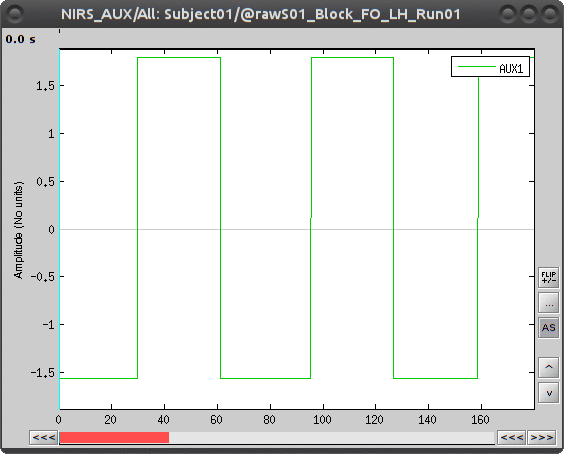
To transform this signal into Brainstorm events, drag and drop the NIRS data "S01_Block_FO_LH_Run01 |- Link to raw file" in the Brainstorm process window. Click on "Run" and select Process "Events -> Read from channel".
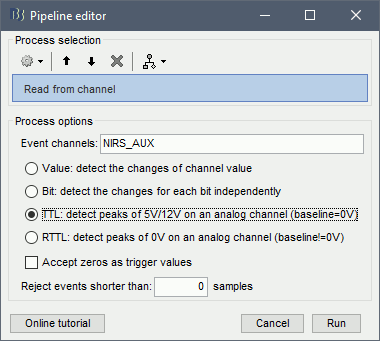
Use the following parameters:
set "Event channels" to "NIRS_AUX"
select "TTL: detect peaks ...". This is the method to extract events from the AUX signal.
Run the process.
Then right-click on "Link to raw file" under "S01_Block_FO_LH_Run01" then "NIRS -> Display time series".
The panel on the left shows the events, where there should be an event group called "AUX1".
In the top menu "Events", select "Rename Group", and rename it to "MOTOR".
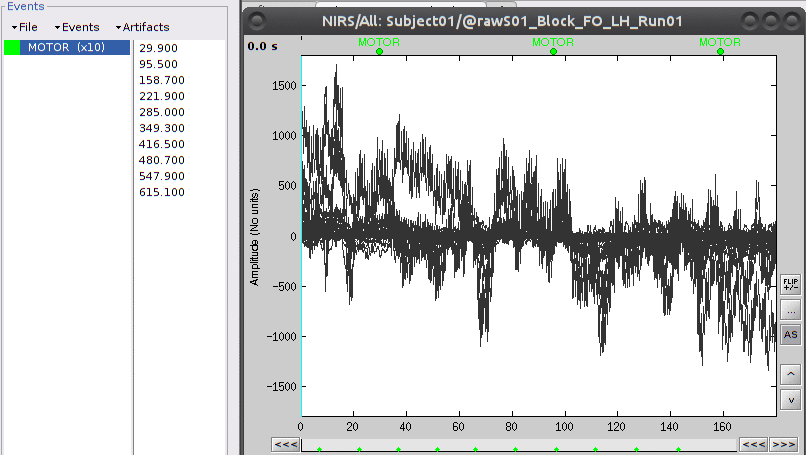
The "MOTOR" event group has 10 events which are shown in green on the top of the plot.
Movement correction
In fNIRS data, a movement usually induces a spiked signal variation and shifts the signal baseline. A movement artefact spreads to all channels as the whole head or several scalp muscles are moving. The correction process available is semi-atomatic as it requires the user to tag the movement events. The method used to correct movement is based on spline interpolation.
To tag specific events (see this tutorial for a complete presentation of event marking), double-click on "Link to raw file" under "S01_Block_FO_LH_Run01" then in the "Events" menu, select "Add group" and enter "NIRS_mvt".
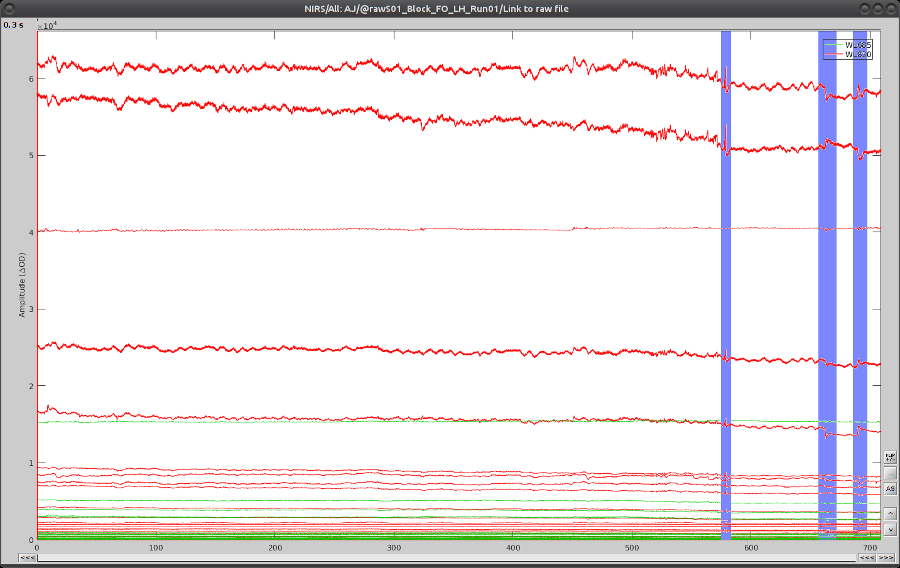
On the time-series, we can identify 3 obvious movement events, highlighted in blue here:
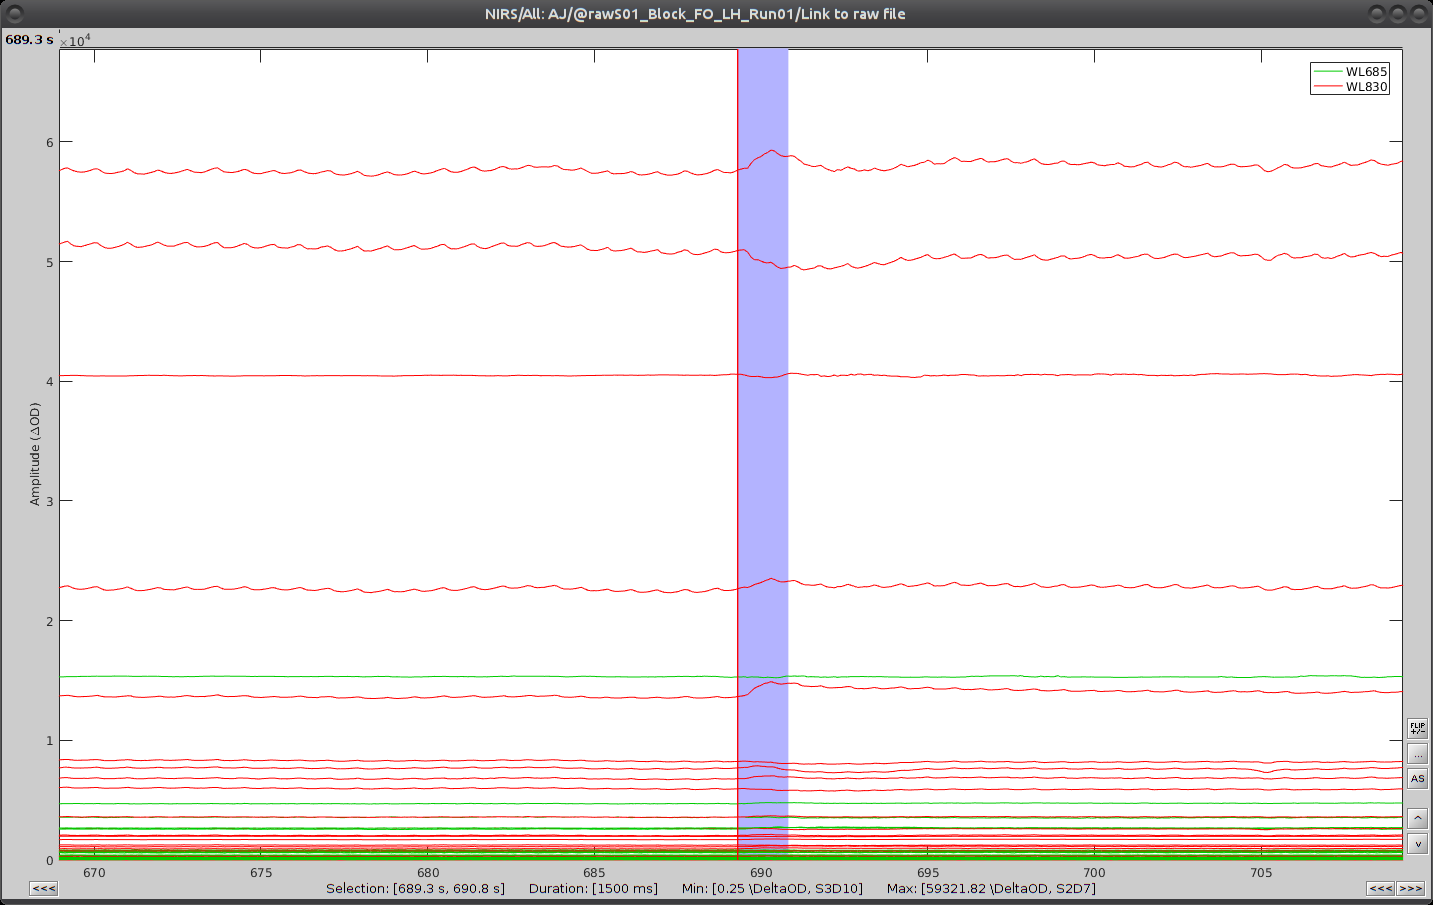
Use shift-left-click to position the temporal marker at the beginning of the movement. Then use the middle mouse wheel to zoom on it and use shift-left-click again to precisely adjust the position of the start of the movement event. Drag until the end of the movement event and use CTRL+E to mark the event.
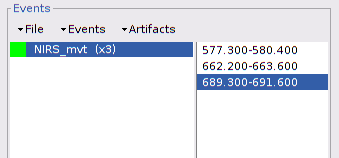
Repeat the operation for all 3 movement events. You should end up with the following event definitions:
After saving and closing all graphic windows, drag and drop "Link to raw file" into the process field and press "Run". In the process menu, select "NIRS > Motion correction".
In the process option window, set "Movement event name" to "NIRS_mvt" then click "Run". To check the result, open the obtained time-series "S01_Block_FO_LH_Run01 |- Motion-corrected NIRS" along with the raw one and zoom at the end of the time-series (shift+left-click then mouse wheel):
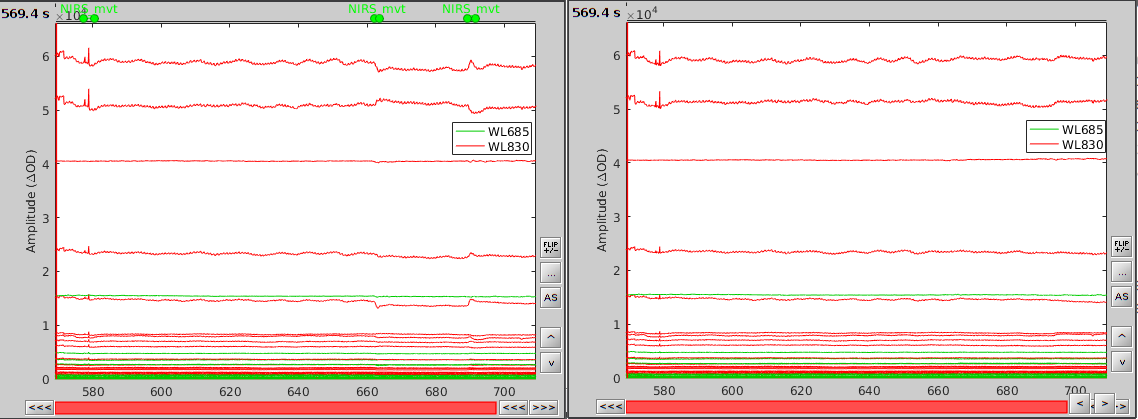
As we can see, the two last movement artefacts are well corrected but the first one is not. This highlights the fact that the motion correction method corrects for rather smooth variations in the signal and spiking events (very rapid movement) are not filtered. However, this is not troubling as spiking artefacts should be filtered out during bandpass filtering.
Note that marked movement events are removed in the resulting data set.
Bad channel tagging
NIRS measurement are heterogeneous (long distance measurements, movements, occlusion by hair) and the signal in several channels might not be properly analysed. A first pre-processing step hence consists in removing those channels.
The following criterions may be applied to reject channels:
some values are negative
signal is flat (variance close to 0)
signal has too many flat segments
Clear the Brainstorm process panel and drag and drop the NIRS data "S01_Block_FO_LH_Run01 |- Motion-corrected NIRS" in it. Click on "Run" and select Process "NIRS -> Detect bad channels".
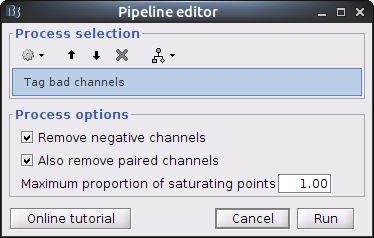
Remove negative channels: tag a channel as bad if it has a least one negative value. This is important for the quantification of delta [Hb] which cannot be applied if there are negative values.
Maximum proportion of saturating point: a saturating point has a value equals to the maximum of the signal. The default is at 1: remove only flat signals. If one wants to also keep flat channels, set the value to at least 1.01.
This process is performed "in place": the channel flags of the given data are modified. To view the result, right-click on "S01_Block_FO_LH_Run01 |- Motion-corrected NIRS" then "Good/Bad Channels > View all bad channels" or "Edit good/bad channels".
Compute [Hb] variations - Modified Beer-Lambert Law
This process computes variations of concentration of oxy-hemoglobin (HbO), deoxy-hemoglobin (HbR) and total hemoglobin (HbT) from the measured light intensity time courses at different wavelengths.
Note that the channel definition will differ from the raw data. Previously there was one channel per wavelength, now there will be one channel per Hb type (HbO, HbR or HbT). The total number of channels may change.
For a given pair, the formula used is:
delta_hb = d-1 * eps-1 * -log(I / I_ref) / (dpf/pvf)
where:
delta_hb is the 3 x nb_samples matrix of delta [Hb],
d is the distance between the pair optodes,
eps is the 3 x nb_wavelengths matrix of Hb extinction coefficients,
I is the input light intensity,
I_ref is a reference light intensity,
dpf is the differential light path correction factor. Computed as: y0 + a1 * age^a2, where y0, a1 and a2 are constants from [Duncan et al 1996] and age is the participant's age
pvf is the partial volume correction factor.
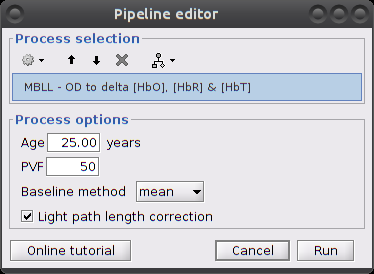
Make sure the item "S01_Block_FO_LH_Run01 |- Motion-corrected NIRS" is in the Brainstorm process panel. Then select Run and "NIRS > MBLL - OD to delta [HbO], [HbR] & [HbT]".
Process parameters:
Age: age of the subject, used to correct for partial light path length
Baseline method: mean or median. Method to compute the reference intensity (I_ref) against which to compute variations.
- PVF: partial volume factor
Light path correction: flag to actually correct for light scattering. If unchecked, then dpf/pvf is set to 1.
This process creates a new condition folder, here "S01_Block_FO_LH_Run01_Hb", because the montage is redefined.
Under "S01_Block_FO_LH_Run01_Hb", double-click on "Hb [Topo]" to browse the delta [Hb] time-series. 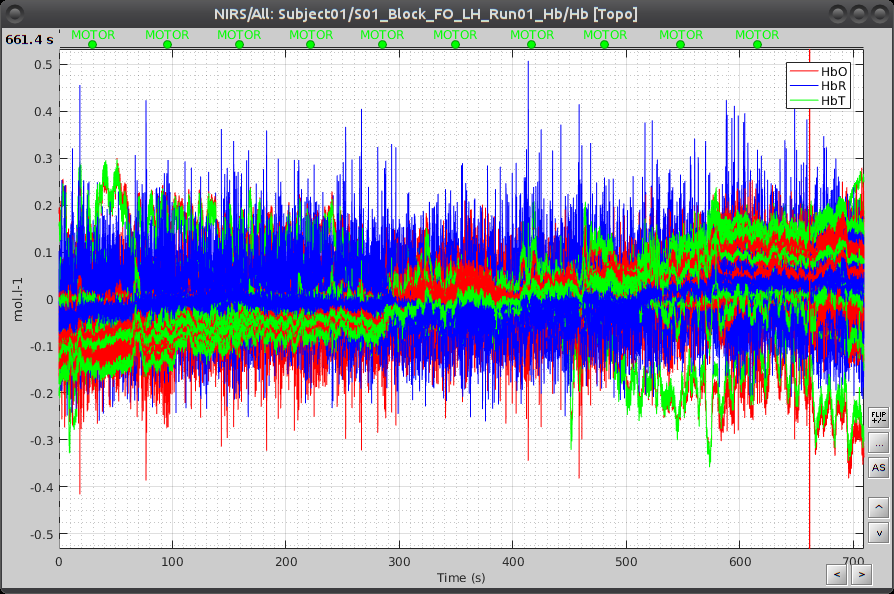
Linear detrend
This filter process removes any linear trend in the signal.
Clear the process window and drag and drop the item "S01_Block_FO_LH_Run01_Hb |- Hb [Topo]" into it. Click on "Run" then select "Pre-process -> Remove linear trend"
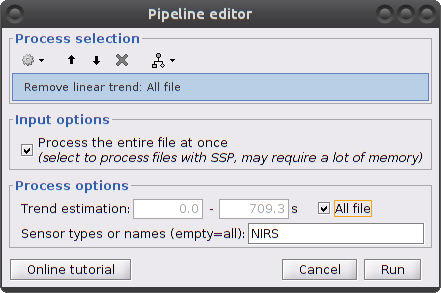
Parameters:
Trend estimation: check "All file"
Sensor types: NIRS. Limit the detrending to actual NIRS measurements (do not treat AUX)
This process creates an item called "Hb | detrend"
Infinite Impulse Response filtering
So far, signals still contain a lot of physiological components of non-interest: heart beats, breathing and Mayer waves. As the evoked signal of interest should be distinct from those components in terms of frequency bands, we can get rid of them by filtering.
Make sure the item "S01_Block_FO_LH_Run01_Hb |-> Hb [Topo] | detrend" is in the Brainstorm process panel. Then select Run and "Pre-process > Band-pass filter".
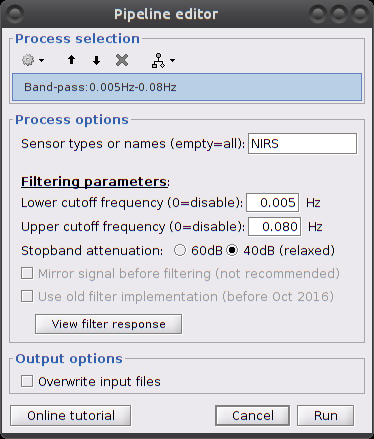
Parameters:
- Sensor types: NIRS. Channel types on which to apply filtering.
- Low cut-off: 0.005 Hz. (lower bound cut-off frequency)
- High cut-off: 0.08 Hz. (higher bound cut-off frequency)
- Stopband attenuation (Hz.): 40dB
- Overwrite input files: if unchecked, then create a new file with the filtered signal.
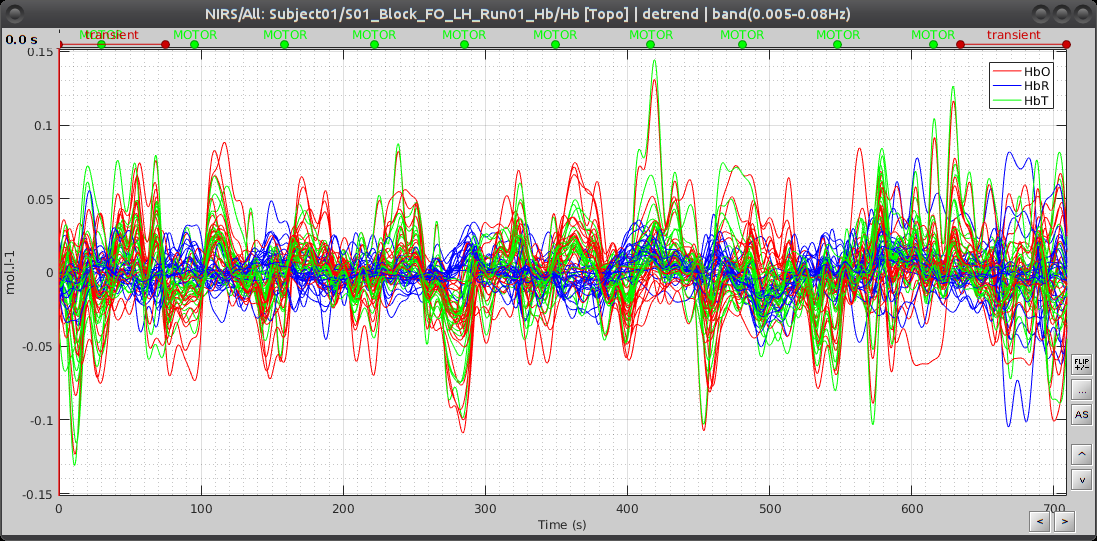
This process creates an item called "Hb [Topo] | detrend | band(0.005-0.08Hz)"
Here is the resulting filtered Hb data:
Window averaging
the goal is to get the response elicited by the motor paradigm. For this, we perform window-averaging time-locked on each motor onset while correcting for baseline differences across trials.
The first step is to split the data into chunks corresponding to the window over which we want to average. The average window is wider than the stimulation events: we'd like to see the return to baseline / undershoot after stimulation.
Right-click on "Hb [Topo] | detrend | IIR filtered -> Import in database"
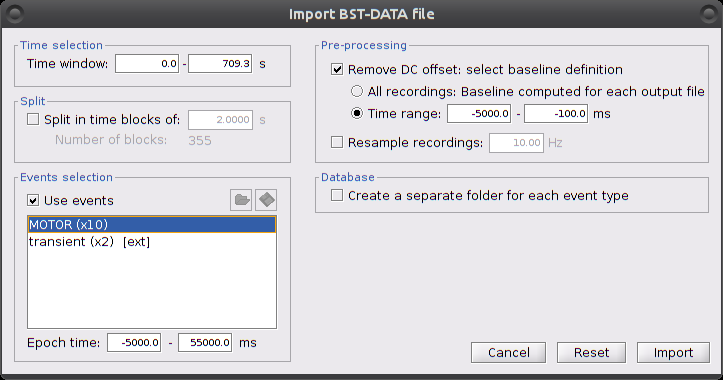
Ensure that "Use events" is checked and that the MOTOR events are selected. The epoch time should be: -5000 to 55000 ms. This means that there will be 5 seconds prior to the stimulation event to check if the signal is steady. There will also be 25 seconds after the stimulation to check the return to baseline / undershoot. In the "Pre-processing" panel, check "Remove DC offset" and use a Time range of -5000 to -100 ms. This will set a reference window prior over which to remove chunk offsets. All signals will be zero-centered according to this window. Finally, ensure that the option "Create a separate folder for each event type" is unchecked".
After clicking on "import", we end up with 10 "MOTOR" data chunks.
The last step is to actually compute the average of these chunks. Clear the process panel then drag and drop the item "MOTOR (10 files)" into it. Click on "run" and select the process "Average -> Average files".
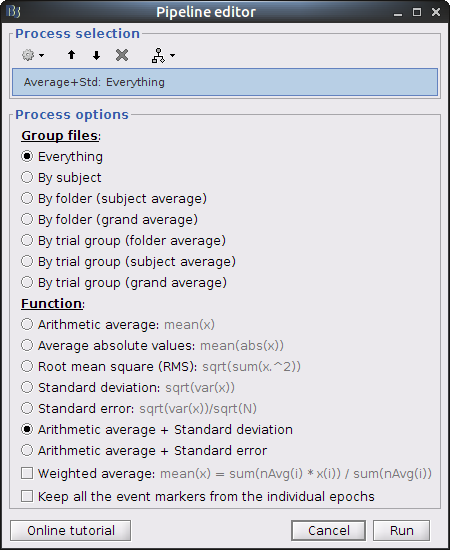
Use Group files: Everything and Function: Arithmetic average + Standard deviation.
To see the results, double click on the created item "AvgStd: MOTOR (10)". To view the values mapped on the channels, right-click on the curve figure and select "View topography". Views are temporally synchronized, so shift-clicking on the curve figure at a specific time position will update the topography view with the channel values at that instant.
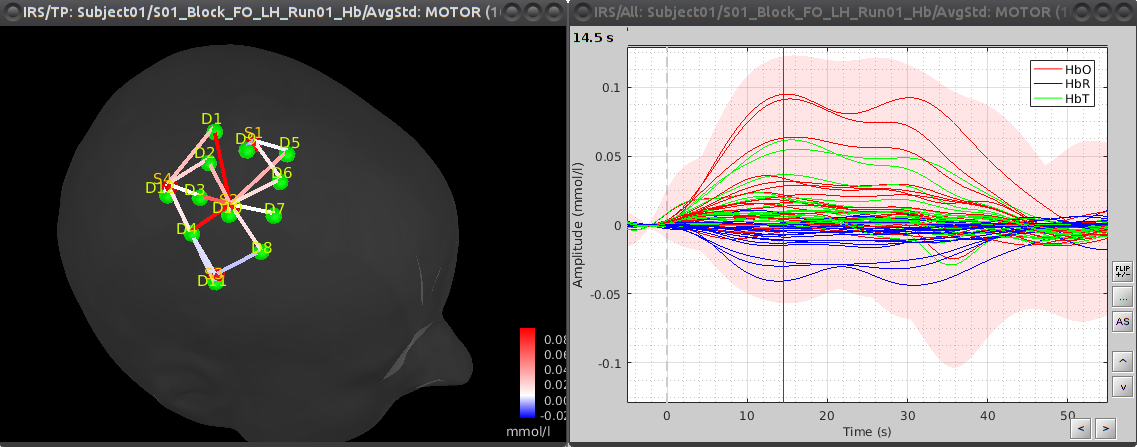
By default, delta [HbO] is displayed in the topography. This can be changed by right-clicking on the 3D view and selecting "Montage > HbR" or "Montage > HbT".
