|
Size: 7523
Comment:
|
Size: 7363
Comment:
|
| Deletions are marked like this. | Additions are marked like this. |
| Line 22: | Line 22: |
| * '''John''': Explain the donut shapes of the min norm maps we always get with this new function. | |
| Line 72: | Line 73: |
| == Tutorial 27: Workflows == * Add Chi2(log) ? == Group study tutorial == * Statistics must be validated and results must be explained properly. * http://neuroimage.usc.edu/brainstorm/Tutorials/VisualGroup#Group_analysis:_Sources |
|
| Line 74: | Line 81: |
| === Tutorial 25: Difference === * Francois: Update screen captures for band-pass filter |
|
| Line 77: | Line 82: |
| === Tutorial 28: Scripting === * Francois: Update screen captures for band-pass filter === Tutorial epilepsy === * Francois: Update screen captures for band-pass filter === Tutorial visual group === * Francois: Update screen captures for band-pass filter === Tutorial Yokogawa === * Francois: Update screen captures for band-pass filter == Tutorial 27: Workflows == * Add Chi2(log) ? |
== Connectivity == * Not documented at all * '''Richard, Sylvain''': Define example dataset and precise results to obtain from them * '''Richard, Sylvain''': How to deal with unconstrained sources?<<BR>> http://neuroimage.usc.edu/forums/showthread.php?2401 * '''Richard''': How to assess significance from connectivity matrices? * '''Richard, Hossein, Francois''': Preparation of a tutorial * All the functions using bandpass filters must be updated to use the new filters |
| Line 99: | Line 97: |
== Connectivity == * Not documented at all * '''Richard, Sylvain''': Define example dataset and precise results to obtain from them * '''Richard, Sylvain''': How to deal with unconstrained sources?<<BR>> http://neuroimage.usc.edu/forums/showthread.php?2401 * '''Richard''': How to assess significance from connectivity matrices? * '''Richard, Hossein, Francois''': Preparation of a tutorial * All the functions using bandpass filters must be updated to use the new filters |
Introduction tutorials: Editing process
Redactors:
Francois Tadel: Montreal Neurological Institute
Elizabeth Bock: Montreal Neurological Institute
Reviewers: [current reviewing status]
Sylvain Baillet: Montreal Neurological Institute [overview 1-14, edited 20-21]
Richard Leahy: University of Southern California [validated 1-20]
John Mosher: Cleveland Clinic [edited 22 only]
Dimitrios Pantazis: Massachusetts Institute of Technology [validated 1-15]
Inverse models
Tutorial 22: Source estimation
[CODE]
John: Inverse code: Mixed head models are still not supported.
John: Explain the new (incorrect) results obtained with the epilepsy tutorial (see below)
John: Explain the donut shapes of the min norm maps we always get with this new function.
John: Drop the option "RMS source amplitude"?
- The documentation is not informative and not encouraging at all: "RMS source amplitude: An alternative definition of SNR, but still under test and may be dropped."
- The option is not even accessible in the interface: you successively asked me to disable it for the min norm, and then made me hide the entire section "Regularization parameter" for the dipole modelling and the beamformer.
- Can I just remove it from the interface?
- Francois: Update code, tutorials and screen captures accordingly
John, Richard, Sylvain, Matti, Alex: Make the "median eigenvalue" option the default?
- John suggests to use the "median eigenvalue" option by default instead of the option "Regularize noise covariance", which as been used for many years.
In this section of the tutorials, John wrote: "Recommended option: This author (Mosher) votes for the median eigenvalue as being generally effective. The other options are useful for comparing with other software packages that generally employ similar regularization methods."
- However this modifies a lot the results: the localization results and the MN amplitudes can be very different. If this is a clear improvement, it's good to promote it. But it cannot be done randomly like this, this has to be discussed (especially with Matti and Alex) and tested.
- John: Please arrange a meeting so you can discuss this question.
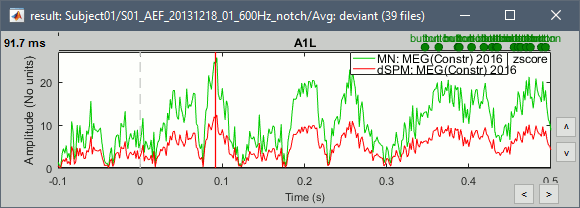
John, Richard, Sylvain: Why are dSPM values 2x lower than Z-score ?
- The tutorial says "Z-normalized current density maps are also easy to interpret. They represent explicitly a "deviation from experimental baseline" as defined by the user. In contrast, dSPM indicates the deviation from the data that was used to define the noise covariance used in computing the min norm map. "
Therefore should we expect the dSPM values to deviate more from the noise recordings, than the Z-score from the pre-stim baseline? Instead of this we observe much lower values. Is there a scaling issue here?

John: Mixing GRAD and MAG:
John: You do not recommend processing GRAD and MAG at the same time? This is currently the default behavior in the interface...
John: Please discuss this with Matti and Alex
Francois: Change the default + add note in Elekta tutorial if change is validated
Francois: Call FieldTrip headmodels and beamformers
[ONLINE DOC]
John: Fix all the missing links
John: Data covariance:
Recommendations moved to the Noise and data covariance tutorial.
- You said: "Our recommendation for evoked responses is to use a window that spans prestim through the end of the response of interest, with a minimum of 500ms total duration. "
- Should I modify the interface (and screen capture of the example) to always include the pre-stim baseline (eg. from -100ms to +500ms, instead of from 0ms to +500ms) ?
Francois: Update the screen capture + code for default selection of the time window
Tutorial: Dipole scanning
John: Unfinished sentence in this section.
Tutorial EEG/Epilepsy
John: Why sLORETA?
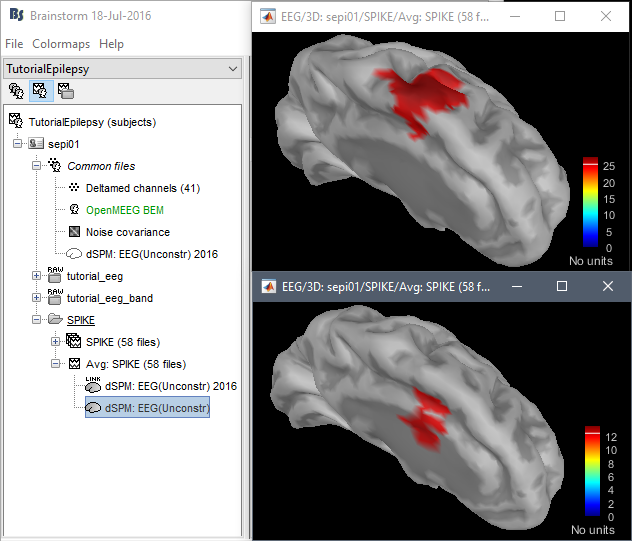
John: Please address the location issues with the new code:
dSPM is now localizing the spike in a much deeper spot (top=old version, bottom=new version)

Marcel wrote: "Looking at the findings from the intracranial EEG in Matthias Dümpelmann's article (figure 1 panel a) and b)) it is very likely the new sources are wrong. Additionally, the older sources are much more in agreement with Matthias' sLORETA results and with cMEM findings. Sohrabopour et al. reported as well that their IRES method found results in agreement with sources shown in the tutorial."
Imported data for testing can be downloaded here:
https://www.dropbox.com/s/42d9indpjr8ac1y/TutorialEpilepsy.zip?dl=0
Filters
Tutorial 10: Power spectrum and frequency filters
[CODE]
Hossein, Francois: Update the code for the band-stop and notch filters in the same way
- Look at code in each case and write additional code to compute equivalent impulse response and give transient duration (99%) energy info as well as frequency and impulse response plots to user as we do with the bandpass/lowpass filters.
[ONLINE DOC]
Hossein, Francois: Section Filters specifications for band-stop and notch filters
Francois: Update section "Apply a notch filter" to add the transients in screen capture and text (after the documentation of the notch filter)
Tutorial 27: Workflows
- Add Chi2(log) ?
Group study tutorial
- Statistics must be validated and results must be explained properly.
http://neuroimage.usc.edu/brainstorm/Tutorials/VisualGroup#Group_analysis:_Sources
Connectivity
- Not documented at all
Richard, Sylvain: Define example dataset and precise results to obtain from them
Richard, Sylvain: How to deal with unconstrained sources?
http://neuroimage.usc.edu/forums/showthread.php?2401Richard: How to assess significance from connectivity matrices?
Richard, Hossein, Francois: Preparation of a tutorial
- All the functions using bandpass filters must be updated to use the new filters
Final steps
- Francois: Remove all the wiki pages that are not used
- Francois: Check all the links in all the pages
- Francois: Check that all the TODO blocks have been properly handled
- Francois: Remove useless images from all tutorials
- Francois: Update page count on the main tutorials page
Francois: Reference on ResearchGate, Academia and Google Scholar
http://neuroimage.usc.edu/brainstorm/Tutorials/AllIntroduction
