|
Size: 4167
Comment:
|
Size: 5334
Comment:
|
| Deletions are marked like this. | Additions are marked like this. |
| Line 18: | Line 18: |
| == Tutorial 10: Power spectrum and frequency filters == | == Filters == === Tutorial 10: Power spectrum and frequency filters === |
| Line 30: | Line 31: |
| == Tutorial 13: Artifact cleaning with SSP == | === Tutorial 13: Artifact cleaning with SSP === |
| Line 35: | Line 36: |
| == Tutorial 15: Import epochs == | === Tutorial 15: Import epochs === |
| Line 40: | Line 41: |
| == Tutorial 20: Head modeling == [ONLINE DOC] * John: In-depth review of this sensitive tutorial * John: Section [[http://neuroimage.usc.edu/brainstorm/Tutorials/HeadModel#Additional_documentation_.5BTODO.5D|References]] == Tutorial 22: Source estimation == |
== Inverse models == === Tutorial 22: Source estimation === |
| Line 50: | Line 46: |
| * John: Explain the new results obtained with the epilepsy tutorial | * John: Explain the new (incorrect) results obtained with the epilepsy tutorial |
| Line 53: | Line 49: |
| * John, Richard, Sylvain: Why are dSPM values 2x lower than Z-score ? * The tutorial says "Z-normalized current density maps are also easy to interpret. They represent explicitly a "deviation from experimental baseline" as defined by the user. In contrast, dSPM indicates the deviation from the data that was used to define the noise covariance used in computing the min norm map. " * Therefore should we expect the dSPM values to deviate more from the noise recordings, than the Z-score from the pre-stim baseline? Instead of this we observe much lower values. Is there a scaling issue here? <<BR>><<BR>> {{attachment:diff_zscore_dspm.gif||width="385",height="138"}} |
|
| Line 61: | Line 60: |
| * John, Richard, Sylvain: Why are dSPM values 2x lower than Z-score ? <<BR>> {{attachment:diff_zscore_dspm.gif||width="424",height="152"}} | |
| Line 63: | Line 61: |
=== Tutorial: Dipole scanning === * Add the description of all the measures in [[http://neuroimage.usc.edu/brainstorm/Tutorials/TutDipScan#Significance_mesures_.5BTODO.5D|this section]]. === Tutorial EEG/Epilepsy === * Why sLORETA? * Location issues with the new code: <<BR>>dSPM is now localizing the spike in a much deeper spot (top=old version, bottom=new version) <<BR>><<BR>> {{attachment:epilepsy_dspm.gif}} * '''Marcel Heers''': "Looking at the findings from the intracranial EEG in Matthias Dümpelmann's article (figure 1 panel a) and b)) it is '''very likely the new sources are wrong'''. Additionally, the older sources are much more in agreement with Matthias' sLORETA results and with cMEM findings. Sohrabopour et al. reported as well that their IRES method found results in agreement with sources shown in the tutorial." * Imported data for testing can be downloaded here:<<BR>> https://www.dropbox.com/s/42d9indpjr8ac1y/TutorialEpilepsy.zip?dl=0 |
|
| Line 76: | Line 83: |
| == Tutorial: Dipole scanning == * Add the description of all the measures in [[http://neuroimage.usc.edu/brainstorm/Tutorials/TutDipScan#Significance_mesures_.5BTODO.5D|this section]]. == Tutorial EEG/Epilepsy == * Why sLORETA? * Location with the new code? |
Introduction tutorials: Editing process
http://neuroimage.usc.edu/brainstorm/Tutorials
Redactors:
Francois Tadel: Montreal Neurological Institute
Elizabeth Bock: Montreal Neurological Institute
Reviewers: [current reviewing status]
Sylvain Baillet: Montreal Neurological Institute [overview 1-14, edited 20-21]
Richard Leahy: University of Southern California [validated 1-20]
John Mosher: Cleveland Clinic [edited 22 only]
Dimitrios Pantazis: Massachusetts Institute of Technology [validated 1-15]
Filters
Tutorial 10: Power spectrum and frequency filters
[CODE]
- Richard, Hossein: Define reasonable transient durations
- Richard, Hossein: Describe the band-stop and notch filters in the same way
- Richard, Hossein: Frequency resolution in the "freqz" plots for high-pass filters under 0.5Hz
- Richard, John, Hossein, Sylvain: Weird PSD plots for Elekta recordings
[ONLINE DOC]
Richard, Hossein: Section Filters specifications for band-stop and notch filters
Tutorial 13: Artifact cleaning with SSP
[CODE]
Francois: Check the length needed to filter the recordings (after finishing #10)
Section SSP Algorithm
Tutorial 15: Import epochs
[ONLINE DOC]
Richard, Sylvain, John, Francois: Define recommendations for epoch lengths (after finishing #10)
Section Epoch length
Inverse models
Tutorial 22: Source estimation
[CODE]
- John: Inverse code: Mixed head models
- John: Explain the new (incorrect) results obtained with the epilepsy tutorial
- John: Discuss and validate all the modifications with Alex and Matti
- John: Cannot process GRAD and MAG at the same time ?
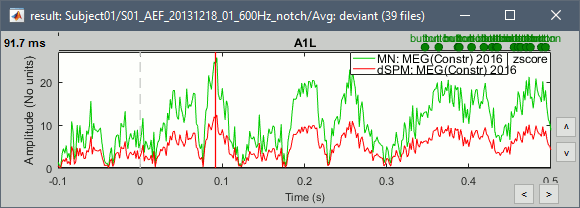
- John, Richard, Sylvain: Why are dSPM values 2x lower than Z-score ?
- The tutorial says "Z-normalized current density maps are also easy to interpret. They represent explicitly a "deviation from experimental baseline" as defined by the user. In contrast, dSPM indicates the deviation from the data that was used to define the noise covariance used in computing the min norm map. "
Therefore should we expect the dSPM values to deviate more from the noise recordings, than the Z-score from the pre-stim baseline? Instead of this we observe much lower values. Is there a scaling issue here?

- Francois: Make the "median" option the default? (changes a lot the range of values)
Francois: Call FieldTrip headmodels and beamformers
- Francois: Add note in Elekta tutorial: Process MAG and GRAD separately
[ONLINE DOC]
- John: Fix all the missing links
John, Richard, Sylvain: Section References
John, Richard, Sylvain: What do with Hui-Ling Beamformers?
Tutorial: Dipole scanning
Add the description of all the measures in this section.
Tutorial EEG/Epilepsy
- Why sLORETA?
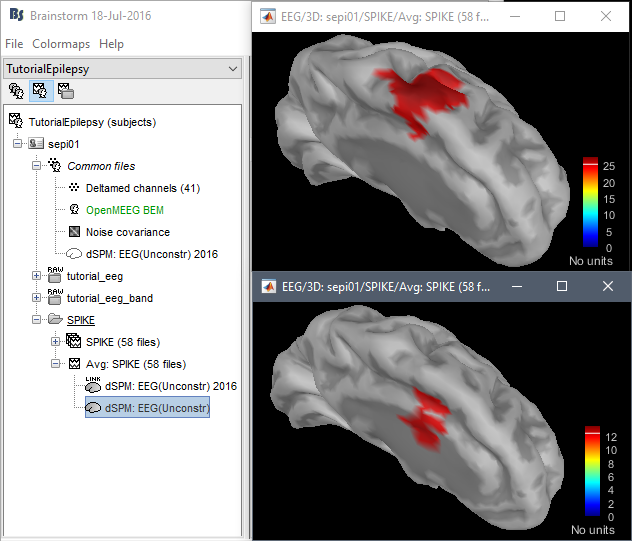
Location issues with the new code:
dSPM is now localizing the spike in a much deeper spot (top=old version, bottom=new version)

Marcel Heers: "Looking at the findings from the intracranial EEG in Matthias Dümpelmann's article (figure 1 panel a) and b)) it is very likely the new sources are wrong. Additionally, the older sources are much more in agreement with Matthias' sLORETA results and with cMEM findings. Sohrabopour et al. reported as well that their IRES method found results in agreement with sources shown in the tutorial."
Imported data for testing can be downloaded here:
https://www.dropbox.com/s/42d9indpjr8ac1y/TutorialEpilepsy.zip?dl=0
Tutorial 24: Time-frequency
[CODE]
- Francois: Enable option "Hide edge effects" for Hilbert (after finishing #10)
[ONLINE DOC]
- Francois: Hilbert: Link back to the filters tutorial (after finishing #10)
Tutorial 27: Workflows
- Add Chi2(log) ?
Final steps
- Francois: Remove all the wiki pages that are not used
- Francois: Check all the links in all the pages
- Francois: Remove useless images from all tutorials
Francois: Reference on ResearchGate, Academia and Google Scholar
http://neuroimage.usc.edu/brainstorm/Tutorials/AllIntroduction
Connectivity
- Not documented at all
- Richard, Sylvain: Define example dataset and precise results to obtain from them
Richard: How to deal with unconstrained sources?
http://neuroimage.usc.edu/forums/showthread.php?2401- Richard: How to assess significance from connectivity matrices?
- Francois, Richard, Hossein: Preparation of a tutorial
