|
Size: 3987
Comment:
|
Size: 3817
Comment:
|
| Deletions are marked like this. | Additions are marked like this. |
| Line 12: | Line 12: |
| = Example 1: Metal in the mouth = | = Example 1: removing artifacts that are continuous = |
| Line 15: | Line 15: |
| The first step is to identify the artifact and channel(s) that are most affected. After scanning though the data, it appears there are two artifacts that are throughout the recording. | The first step is to identify the artifact and channel(s) that are most affected. After scanning though the data, it appears there are some artifacts present throughout the recording. |
| Line 17: | Line 17: |
| {{attachment:dental_and_sensor_artifacts.png||height="500",width="700"}} | {{attachment:dental_and_sensor_artifacts.png||height="500",width="600"}} |
| Line 19: | Line 19: |
| First, slower perturbations in the posterior temporal areas, as seen in the channels highlighted in red. Then there are and sharp 'jumps', highlighted in blue, which do not seem to be physiological. In addition, performing a power spectrum density (PSD) helps identify the channels and the frequencies which are most affected by these artifacts. | First, slower perturbations in the posterior temporal areas, as seen in the channels highlighted in red. Then there are sharp 'jumps', highlighted in blue, which do not seem to be physiological, but instead are most likely sensor noise. We can also see artifacts from the heart. |
| Line 21: | Line 21: |
| {{attachment:PSD_topo_artifacts.png||height="300",width="700"}} | In addition, performing a power spectrum density (PSD) helps identify the channels and the frequencies which are most affected by these artifacts. {{attachment:PSD_topo_artifacts.png||height="250",width="600"}} |
| Line 36: | Line 38: |
| 1. Run the process 1. Review the resulting projectors and find component(s) that eliminate the artifact. Be sure to review the topography and the time series of the component to confirm you are only removing the artifact. |
|
| Line 37: | Line 41: |
| 1. Run the process 1. Review the resulting projectors and find component(s) that eliminates the artifact. Be sure to review the topography and the time series of the component to be sure you are only removing the artifact. After selecting the first component, I see that the second one is not appropriate since it contains a dipole over the auditory regions. 1. Check for additional artifacts. I see that there is still some artifacts left on channel MLT57 and so I mark these as events (event type artifact_MLT57). This can be done using the generic event detection on that specific channel or they can be marked manually. 1. Compute an SSP projection on these artifacts, but use the second strategy where the artifact is an event. * Time window: this should be the time window of the entire recording * Event name: artifact_MLT57 * Event window: here is see these more discrete events are lasting about 400-500ms, so I choose an event window to be [-200,200]ms. * Frequency band: again, this artifact is mostly defined in [0.5,10]Hz. * Sensor types: MEG * Compute using existing: check this box because now we want to find what is left after the continuous component is removed * Save averaged artifact: uncheck this box * Method to calculate: I chose PCA (Here you can choose either PCA or average. Try both since one may work better than the other). |
{{attachment:eight_components_PCA.png||height="400",width="600"}} |
| Line 50: | Line 43: |
| 1. Select the appropriate topography. Here I chose the first two. 1. Now do the same for cardiac events. Select the appropriate component. Here I chose the first one only. |
We can see here that the first two components are most likely artifacts. Selecting these two does a very good job of removing the artifact. {{attachment:dental_and_sensor_artifacts_cleaned.png||height="500",width="600"}} 1. Now do the same for cardiac events. Detect the events either from the ECG channel or from an MEG sensor. In this case, we do not have an extra ECG channel and therefore MRT41 is used. Compute the SSP on those cardiac events. Select the appropriate component. I chose the first one component because it represented the artifact. {{attachment:cardiac_artifact_before.png||height="250",width="300"}} {{attachment:cardiac_artifact_after.png||height="250",width="300"}} Before (left) and after (right) cardiac SSP correction. = Example 2: define an SSP from the topography of an artifact = Here is an example with an artifact from a 3D video monitor that was placed inside the MSR Reviewing the MEG channels and power spectrum reveals a strong artifact at |
Removing artifacts from MEG recordings using Signal Space Projections can sometimes be very efficient. Here are a few tricks to help you remove artifacts from your data that are ongoing or repeating.
General Strategies
We typically use one of three strategies to define an SSP projector:
1. PCA analysis over one continuous epoch (i.e. the entire recording), for which the artifact is ongoing
2. PCA analysis for concatenated 'events', for which the artifact is discrete and repeating in the recording
3. Visual identification of one topography that represents the artifact and is converted to an SSP projector.
Example 1: removing artifacts that are continuous
Here the subject has metal dental work that moves when he breathes.
The first step is to identify the artifact and channel(s) that are most affected. After scanning though the data, it appears there are some artifacts present throughout the recording.
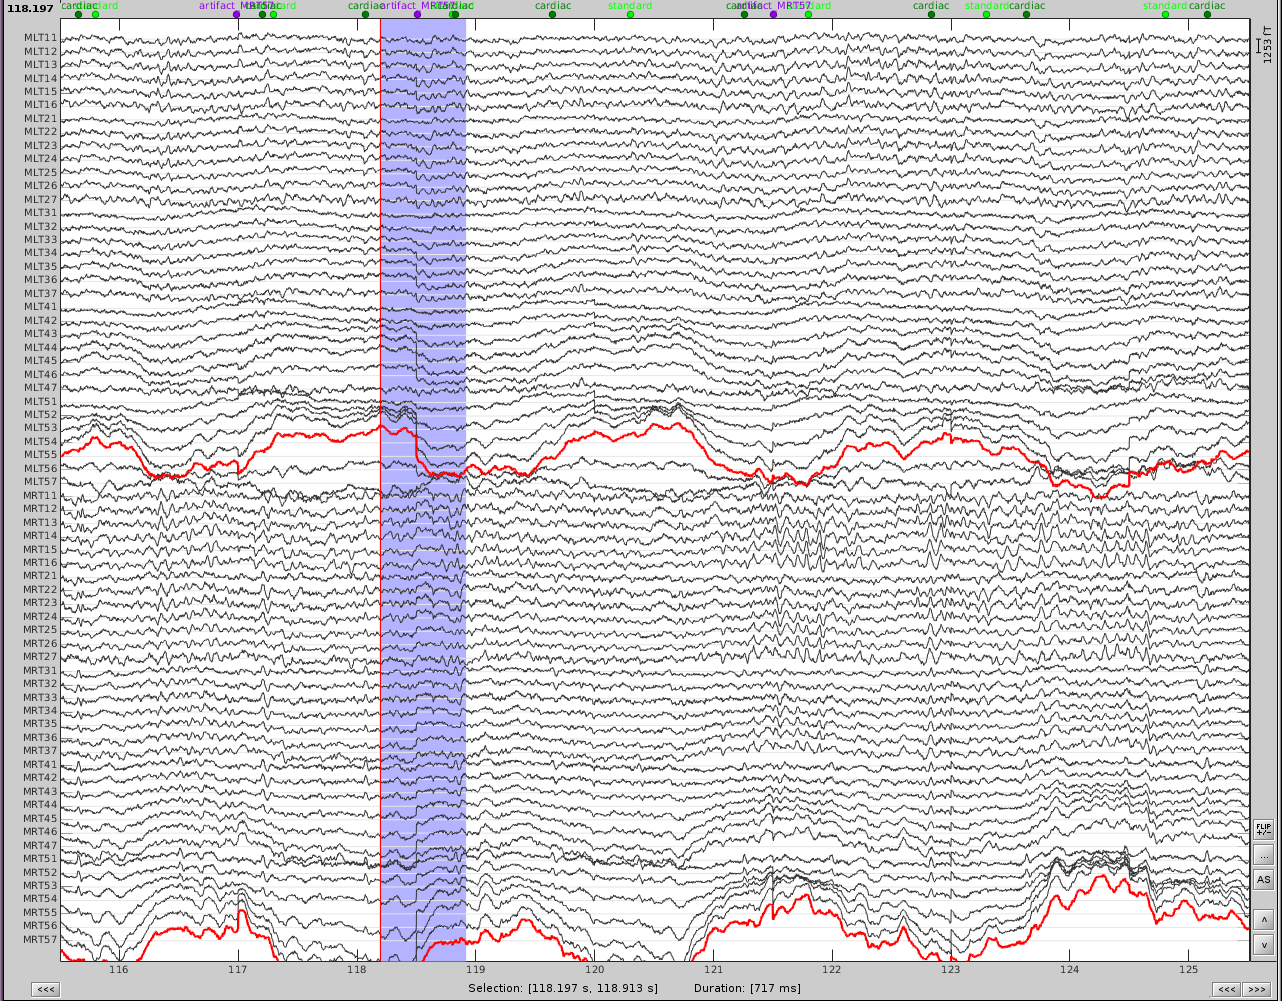
First, slower perturbations in the posterior temporal areas, as seen in the channels highlighted in red. Then there are sharp 'jumps', highlighted in blue, which do not seem to be physiological, but instead are most likely sensor noise. We can also see artifacts from the heart.
In addition, performing a power spectrum density (PSD) helps identify the channels and the frequencies which are most affected by these artifacts.
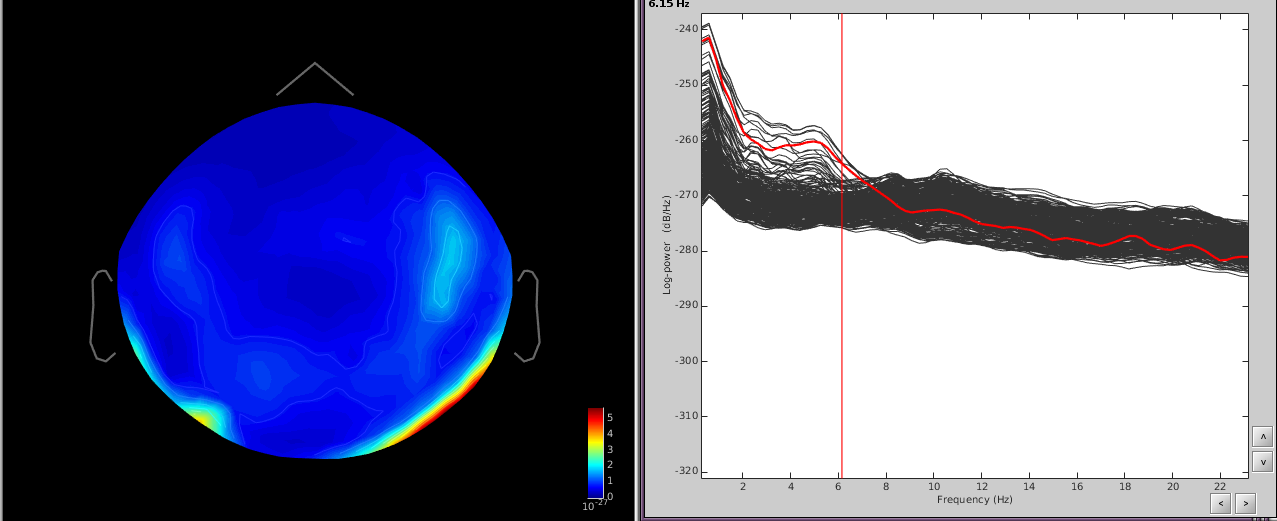
The temporal channels have higher power in the lower freq ([0,6]Hz) and the topography shows a dipole below the posterior part of the sensor array.
Since the slower artifact is ongoing and not necessarily a well-defined 'event', we will use the first strategy.
- Using the Artifacts menu, select SSP: Generic
- Time window: this should be the time window of the artifact. Here I use the first 100 seconds of the recording since the event is well defined in this time, but you can use longer times to better define the event if necessary.
- Event name: empty
- Event window: ignore this
- Frequency band: from the PSD I can see that the artifact is mostly defined in [0.5,10]Hz. If you know the freq band of the artifact, you should adjust this accordingly, if not, you can use a more broadband to get an overall view.
- Sensor types: MEG
- Compute using existing: uncheck this box
- Save averaged artifact: uncheck this box
- Method to calculate: choose PCA
- Run the process
- Review the resulting projectors and find component(s) that eliminate the artifact. Be sure to review the topography and the time series of the component to confirm you are only removing the artifact.
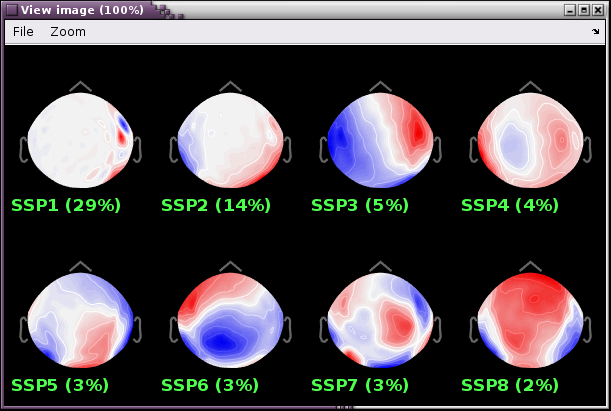
We can see here that the first two components are most likely artifacts. Selecting these two does a very good job of removing the artifact.
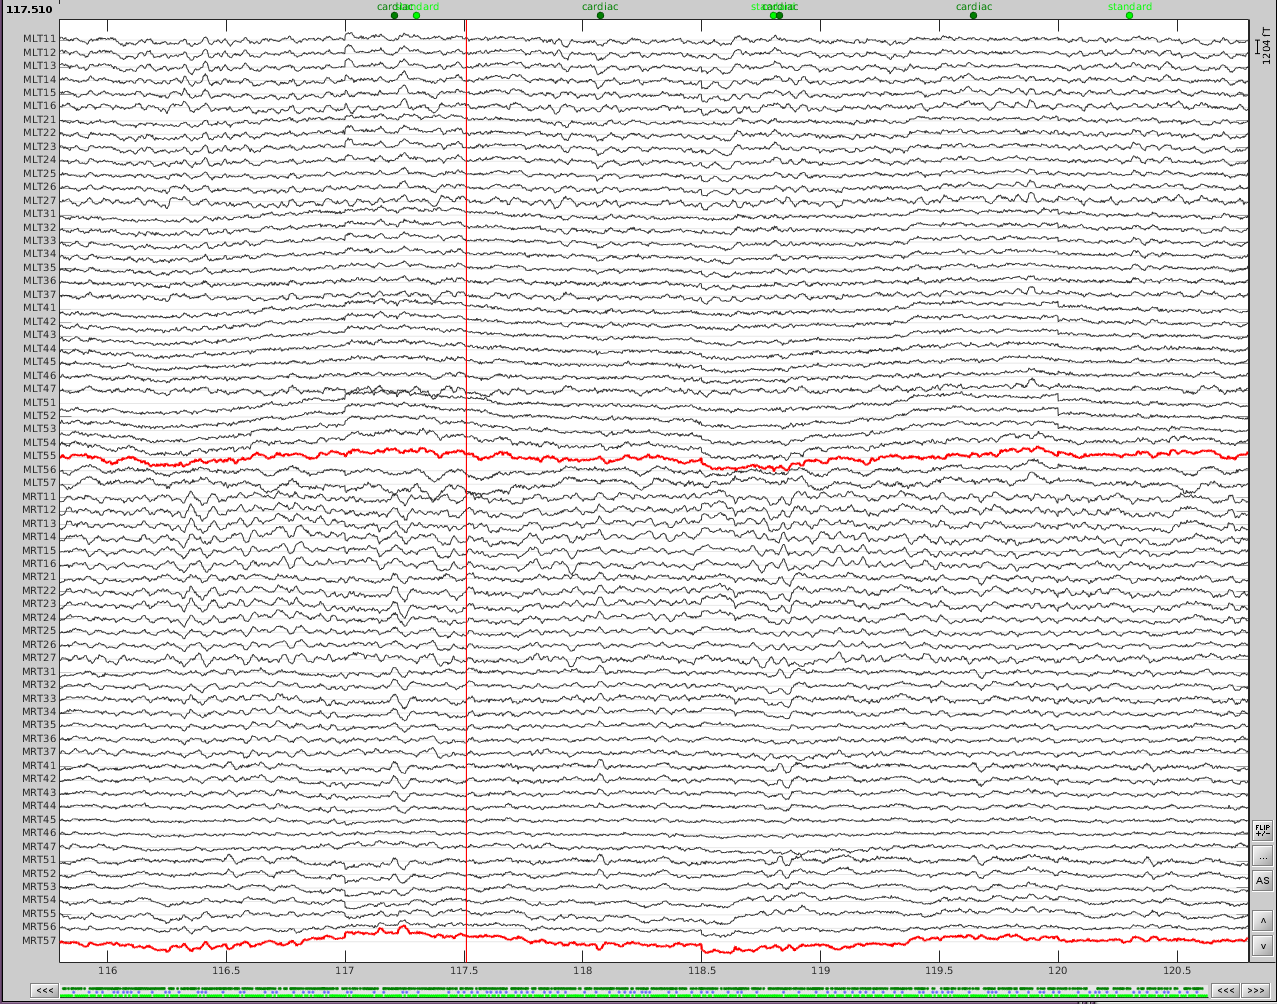
- Now do the same for cardiac events. Detect the events either from the ECG channel or from an MEG sensor. In this case, we do not have an extra ECG channel and therefore MRT41 is used. Compute the SSP on those cardiac events. Select the appropriate component. I chose the first one component because it represented the artifact.
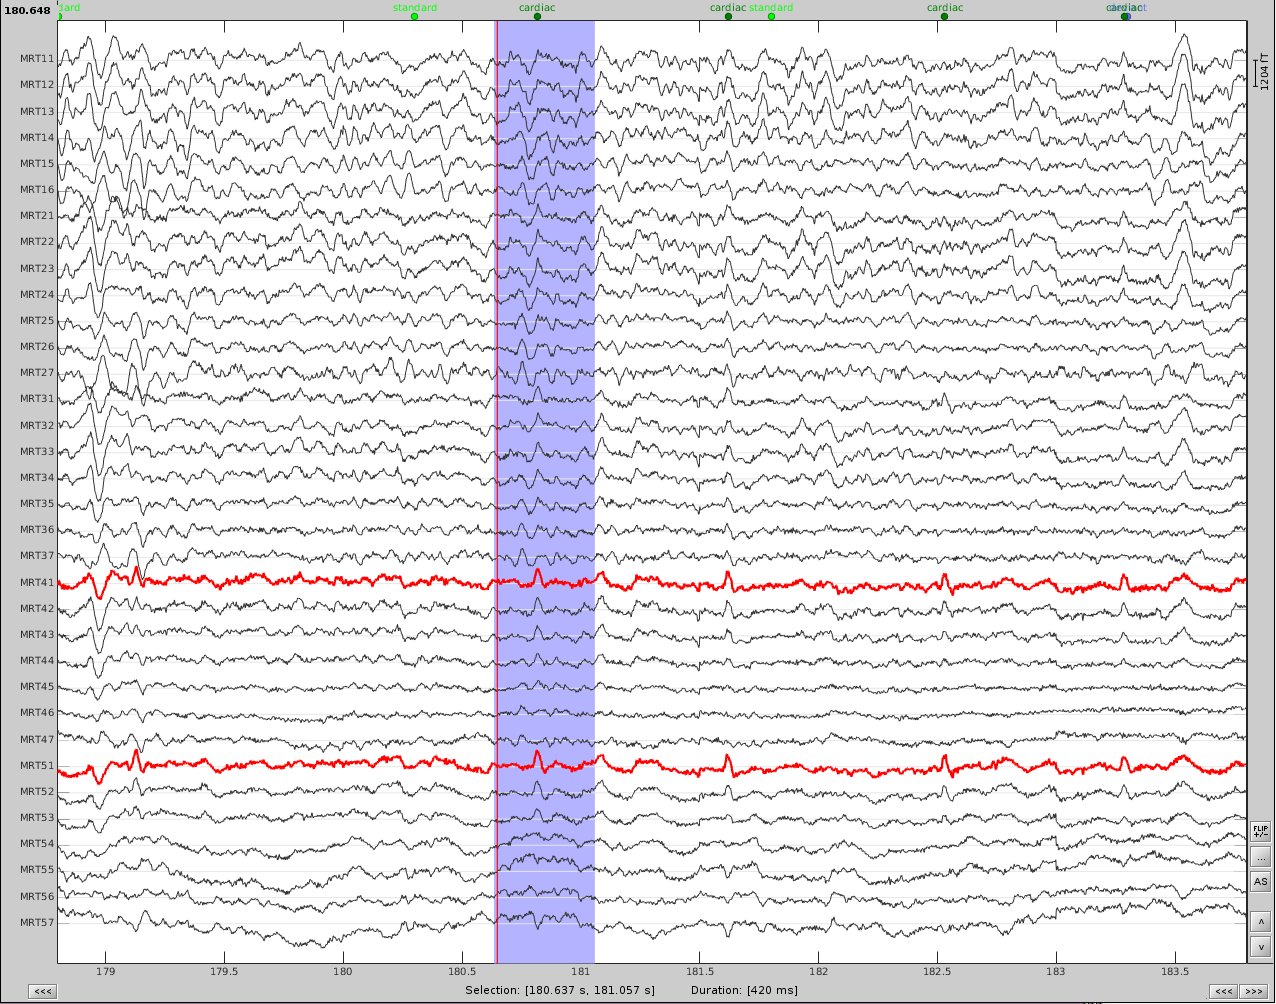
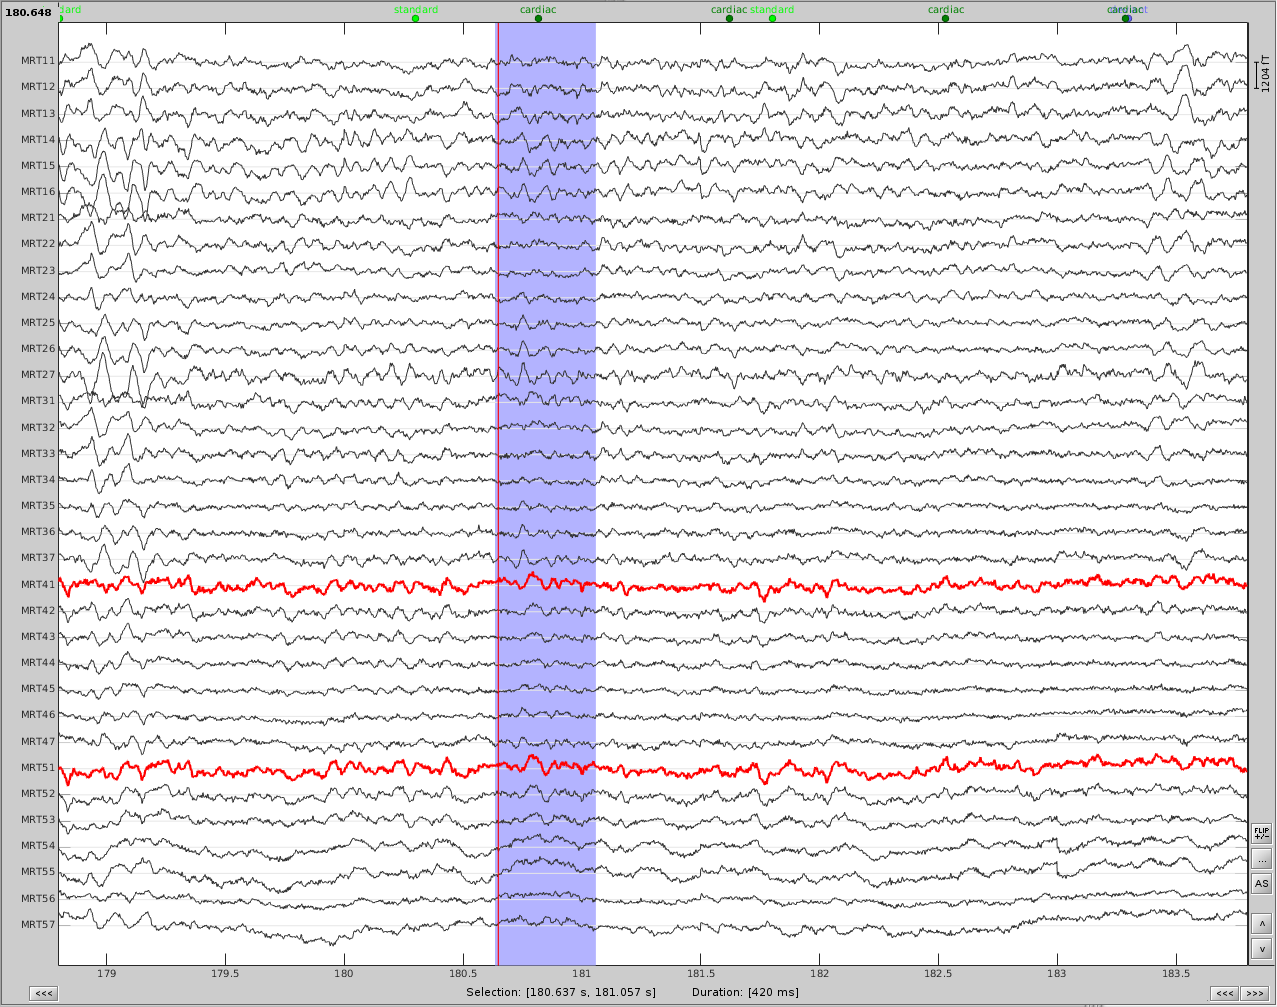
Before (left) and after (right) cardiac SSP correction.
Example 2: define an SSP from the topography of an artifact
Here is an example with an artifact from a 3D video monitor that was placed inside the MSR
Reviewing the MEG channels and power spectrum reveals a strong artifact at
