|
Size: 6026
Comment:
|
Size: 6178
Comment:
|
| Deletions are marked like this. | Additions are marked like this. |
| Line 1: | Line 1: |
| = Computing and Displaying Dipoles = | = Computing and displaying dipoles = ''Authors: Elizabeth Bock'' |
| Line 14: | Line 16: |
| For this tutorial we will do the scanning on the GLS results. However, the dipole scanning is also available for sources computed with minimum norm z-scored (i.e. MN MEG(Constr) | zscored), dSPM and sLORETA. | For this tutorial we will do the scanning on the GLS results. However, the dipole scanning is also available for sources computed with minimum norm Z-scored (i.e. MN MEG(Constr) | zscored), dSPM and sLORETA. |
| Line 32: | Line 34: |
| * '''Show all time''': plots all selected dipoles at all time points. Un-selecting this options will show only the current time point. | * '''Show all time''': plots all selected dipoles at all time points. Unselecting this options will show only the current time point. |
| Line 68: | Line 70: |
== Feedback == <<EmbedContent(http://neuroimage.usc.edu/brainstorm3_register/get_feedback.php?Tutorials/TutDipScan)>> |
Computing and displaying dipoles
Authors: Elizabeth Bock
Contents
Computing sources using the GLS
This process allows for a systematic scanning of sources using performance measures to display single dipoles. For this tutorial we will use the Generalized Least Squares (GLS) source modeling available in Brainstorm.
Select the protocol TutorialCTF. Right-click on Subject01 / Left / ERF > Compute sources.
In this window, you should select Expert Mode. You will see the following menu. Select [Test] Mosher GLS. Click OK. Use the default settings in the next menu and click OK.
![[ATTACH] [ATTACH]](/moin_static1911/brainstorm1/img/attach.png) ---
--- ![[ATTACH] [ATTACH]](/moin_static1911/brainstorm1/img/attach.png)
Two results were added under the ERF: GLS and GLS-P.
![[ATTACH] [ATTACH]](/moin_static1911/brainstorm1/img/attach.png)
GLS:
GLS-P:
Dipole Scanning
For this tutorial we will do the scanning on the GLS results. However, the dipole scanning is also available for sources computed with minimum norm Z-scored (i.e. MN MEG(Constr) | zscored), dSPM and sLORETA.
Drag and drop the GLS-P link into the Process 1 box. Click Run > Sources > Dipole scanning.
![[ATTACH] [ATTACH]](/moin_static1911/brainstorm1/img/attach.png) ---
--- ![[ATTACH] [ATTACH]](/moin_static1911/brainstorm1/img/attach.png)
- Use the defaults options:
The resulting dipole file is added under the Left condition.
![[ATTACH] [ATTACH]](/moin_static1911/brainstorm1/img/attach.png)
Displaying Dipoles
Right-click ERF|GLSP-dipole-scan > Display on cortex. The Dipoles panel is now open and dipoles are displayed on the cortex. You can now explore the results using the options in the Dipoles panel:
![[ATTACH] [ATTACH]](/moin_static1911/brainstorm1/img/attach.png)
- Data options: filter the available dipoles according the specific measurement. For the GLSP, these are defined as:
Z-score:
Goodness:
Chi-square:
Reduced Chi-square:
Confvolume:
- Display options: these options allow for adjusting how the selected dipoles (according to the Data options) are displayed
Show max goodness: will show the dipole with the maximum goodness (within the constraints of the Data options) at the time point selected. If Show all time is selected, then this represents the maximum goodness over all time points.
Show all time: plots all selected dipoles at all time points. Unselecting this options will show only the current time point.
3D - Color dipoles according to Time, Goodness of Fit, Z-score, Group: adjusts the colormap to reflect the measure.
- Data options: filter the available dipoles according the specific measurement. For the GLSP, these are defined as:
In the Dipoles panel, select Show max goodness of fit, Show all time, and color the dipoles according to Goodness of Fit. You should see the following display. Explore the panel options to familiarize yourself with the capabilities.
![[ATTACH] [ATTACH]](/moin_static1911/brainstorm1/img/attach.png)
Additional Example
Dipole scanning can also be restricted to a scout. In this example, the scanning is restricted to a scout named '2' and colored according to Goodness of Fit
Dipole models from Neuromag's Xfit and CTF's DipoleFit
Brainstorm can import dipoles that have been generated using external software:
Neuromag Source Modelling module, xfit: The .bdip format is described in bdip_format.pdf. For more information about xfit and the bdip format see Neuromag Software Manuals.
CTF DipoleFit: The DipoleFit software and the .dip format is described in the CTF Software Manuals.
To import
- Select the study where you want to import the dipole file
- Right click and select ‘Import dipoles’ (Figure 1)
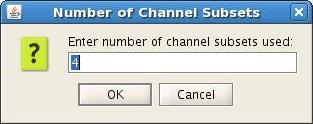
For Neuromag, you will be prompted to specify the number of subsets used for dipole fitting. In most cases, this will be one. If subsets are used, as defined in the text file $HOME/.meg_analysis/xfit_selections, then the number of subsets used needs to be input when prompted. (Figure 2)
![]()
Figure 1. Importing dipoles

Figure 2. Neuromag option for channel subsets
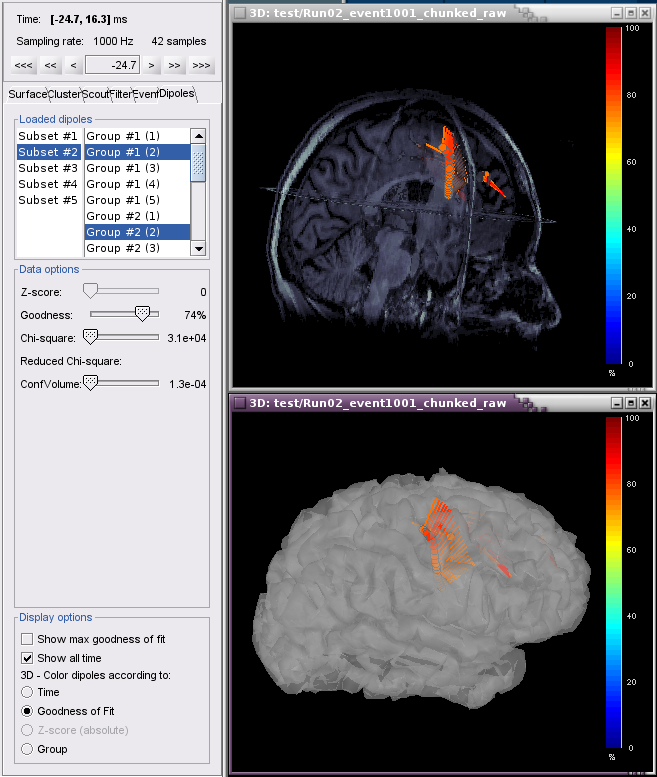
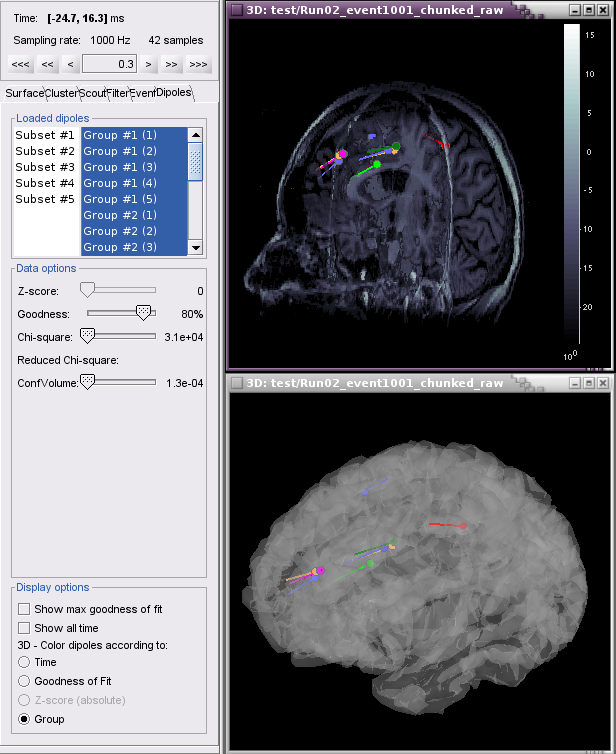
When displaying dipole files with multiple groups and/or subsets, the Loaded dipoles panel appears with a list of dipoles, grouped according to event (Group #1, Group#2, etc) and by channel subset, if used (Subset #1, Subset#2, etc.)
- Select the Group(s) to plot
- Clicking on a subset will select all Groups with that subset. For example, selecting Subset #1 will select Group #1 (1), Group #2 (2), Group #3 (3), etc.
Examples
Example 1 shows 5 subsets (channel groups of Left, Right, Anterior, Posterior, All Channels). When subset #2 is selected, dipoles fitted to the right channels are displayed. In this case, Show all time is selected for the 4 Groups (events) and colored according to Goodness of Fit

Example 2 shows all groups and subsets at one time point (0.3 ms), with goodness of fit greater than 80%, colored according to Group.

Feedback
