|
Size: 1353
Comment:
|
Size: 3897
Comment:
|
| Deletions are marked like this. | Additions are marked like this. |
| Line 11: | Line 11: |
| <<BR>>Now repeat this operation several times to display all the available modes: ''Display time series, 3D sensor cap, 2D sensor cap, 2D disc'' and ''2D Layout''. You should now see all the following figures. | <<BR>>Now repeat this operation several times to display all the available modes: ''Display time series, 3D sensor cap, 2D sensor cap, 2D disc'' and ''2D Layout''. You should now see all the following figures. Keep them opened for the next few paragraphs, we will learn how to manipulate multiple views of the same data. |
| Line 13: | Line 13: |
| * '''Display time series''': values over the time for all the sensors<<BR>><<BR>> {{attachment:dataTimeSeries.gif}} * '''3D sensor cap, ''''''2D sensor cap, 2D disc''': <<BR>><<BR>> {{attachment:data3Dcap.gif}} {{attachment:data2Dcap.gif}} {{attachment:data2Ddisc.gif}} |
* '''Display time series''': values over the time for all the sensors<<BR>><<BR>> {{attachment:dataTimeSeries.gif}} <<BR>>Zoom with mouse wheel, move with left+right or middle mouse click+move * '''3D sensor cap, ''''''2D sensor cap, 2D disc''': The recordings at a given time instant and interpolated over a 2D or 3D surface <<BR>><<BR>> {{attachment:data3Dcap.gif}} {{attachment:data2Dcap.gif}} {{attachment:data2Ddisc.gif}} <<BR>>2D figures: Zoom with mouse wheel, move with left+right or middle mouse click+move<<BR>>3D figures: regular mouse operations as introduced in previous tutorials. |
| Line 16: | Line 16: |
| * '''2D layout''': <<BR>><<BR>> {{attachment:data2Dlayout.gif}} | * '''2D layout''': The time course of each channel is drown at the actual position of the electrode, projected in 2D the same way as ''2D sensor cap'' <<BR>><<BR>> {{attachment:data2Dlayout.gif}} <<BR>>Zoom with mouse wheel, move with left-click+move. |
| Line 19: | Line 19: |
| The time window and the current time instant are centralized and managed by the ''Time window'' panel in Brainstorm window. You can use the text boxes and the slider to set the time bounds or to change the current time value. All the figures always stay synchronized, you cannot display the 2D disc topography at t=10ms and the 3D sensor cap topography at t=50ms at once. It might look too strict at the beginning, but the contrary would have made the interface much too complex; we wanted to keep it as simple as possible. {{attachment:timeWindow.gif}} The time is not the best way to browse your data. There are many other shortcuts that are much more intuitive to navigate through the time. * '''Click on ''''''time series'''''' figure''': just left-click in any white area of the figure and it will move the time cursor at this point, and update all the other figure to match this new value. Don't click on a black line, it would select the corresponding channel instead of moving the time cursor. * '''Press the keyboard arrows''': click on any data figure and try to press several time the left and right arrows, and also the ''PageUp ''and ''PageDown ''keys. This feature is really useful when you want to quickly see how the recordings are changing in the time. It might be a bit slow because you have many figures to refresh at each time change. It should be much faster if you have only one topography window. To remember: An efficient and quick way to review your recordings just after importation is to: 1. Open a Time series window (double click on recordings file) 1. Click on the time of interest (eg. first response peak) 1. Open a topography view of your choice (2D disc, 2D sensor cap, or 3D sensor cap)<<BR>>You can do this by right-clicking on the time series figure > MEG Topography (or Ctrl+T keyboard shortcut). 1. Use the left/right arrows, and PageUp/PageDown keys |
|
| Line 20: | Line 36: |
Tutorial: Explore the recordings
This tutorial is based on the TutorialCTF protocol, and will show you how to explore efficiently the sensory response to an electric stimulation of the fingers. The two previous tutorials explain how to create this tutorial and describe the data that are used in it.
Contents
Display modes
Several display modes are available for recordings. They are all accessible with a right-click.The first three menus (MEG, Stimulation input, Video Time), represent all the different types of channels that were found in the channel file. You can check that with Channel Edit (right-click on channel file > Edit).
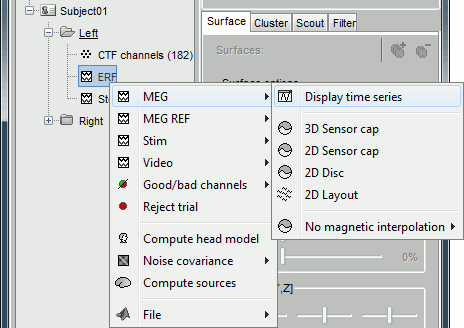
Now repeat this operation several times to display all the available modes: Display time series, 3D sensor cap, 2D sensor cap, 2D disc and 2D Layout. You should now see all the following figures. Keep them opened for the next few paragraphs, we will learn how to manipulate multiple views of the same data.
Display time series: values over the time for all the sensors
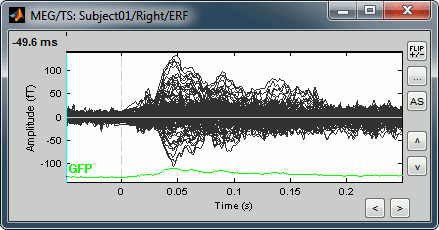
Zoom with mouse wheel, move with left+right or middle mouse click+move3D sensor cap, 2D sensor cap, 2D disc: The recordings at a given time instant and interpolated over a 2D or 3D surface
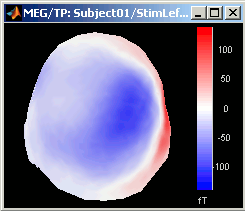
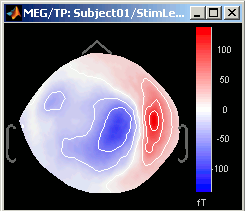
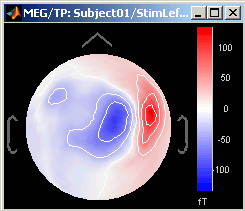
2D figures: Zoom with mouse wheel, move with left+right or middle mouse click+move
3D figures: regular mouse operations as introduced in previous tutorials.2D layout: The time course of each channel is drown at the actual position of the electrode, projected in 2D the same way as 2D sensor cap
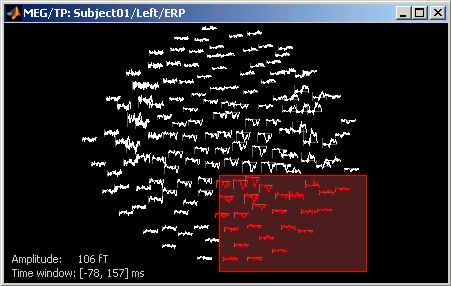
Zoom with mouse wheel, move with left-click+move.
Time exploration
The time window and the current time instant are centralized and managed by the Time window panel in Brainstorm window. You can use the text boxes and the slider to set the time bounds or to change the current time value. All the figures always stay synchronized, you cannot display the 2D disc topography at t=10ms and the 3D sensor cap topography at t=50ms at once. It might look too strict at the beginning, but the contrary would have made the interface much too complex; we wanted to keep it as simple as possible.

The time is not the best way to browse your data. There are many other shortcuts that are much more intuitive to navigate through the time.
Click on time series figure: just left-click in any white area of the figure and it will move the time cursor at this point, and update all the other figure to match this new value. Don't click on a black line, it would select the corresponding channel instead of moving the time cursor.
Press the keyboard arrows: click on any data figure and try to press several time the left and right arrows, and also the PageUp and PageDown keys. This feature is really useful when you want to quickly see how the recordings are changing in the time. It might be a bit slow because you have many figures to refresh at each time change. It should be much faster if you have only one topography window.
To remember: An efficient and quick way to review your recordings just after importation is to:
- Open a Time series window (double click on recordings file)
- Click on the time of interest (eg. first response peak)
Open a topography view of your choice (2D disc, 2D sensor cap, or 3D sensor cap)
You can do this by right-clicking on the time series figure > MEG Topography (or Ctrl+T keyboard shortcut).Use the left/right arrows, and PageUp/PageDown keys
Sensors selection
