|
Size: 730
Comment:
|
Size: 3036
Comment:
|
| Deletions are marked like this. | Additions are marked like this. |
| Line 1: | Line 1: |
| = Tutorial 8: Processes = This tutorial uses Sabine Meunier's somatotopy experiment, called ''TutorialCTF ''in your Brainstorm database. |
= Tutorial 9: Processes = The main window includes a graphical batching interface that directly benefits from the database explorer: files are organized as a tree of subjects and conditions, and simple drag-and-drop operations readily select files for subsequent batch processing. Most of the Brainstorm features are (or will be) available through this interface, including pre-processing of the recordings, averaging, time-frequency decompositions, and computing statistics. A full analysis pipeline can be created in a few minutes, saved in the user’s preferences and reloaded in one click, executed directly or exported as a Matlab script. |
| Line 4: | Line 4: |
| The ''Processes ''tab in Brainstorm window is a very generic tool that can be used to apply a function or extract data from any set of data files (recordings or sources). Its main applications are: pre-processing, averaging, and data extraction. | == Selecting files to process == First thing to do is to define the files you are going to process. This is done easily by picking files or folders in the database explorer and droping them in the empty list of the Process1 tab. |
| Line 6: | Line 7: |
| <<TableOfContents(2)>> | 1. Drag and drop the following nodes in the Process1 list: Right/ERF (recordings), Left (condition), and Subject01 (subject)<<BR>><<BR>> {{attachment:files1.gif}} * A number between brackets appear next to each node: it represents the number of data files that where found in each of them. The node ERF "contains" only itself (1), Subject01/Right contains ERF and Std files (2), and Subject01 contains 2 conditions x 2 recordings (4). * The total number of files, ie. the sum of all those values, appears in the title of the panel "Files to process [8]". 1. The buttons on the left side allow you to select what type of file you want to process: Recordings, sources, time-frequency, other. Now select the second button "Sources". All the counts are updated and now reflect the number of sources files that are found for each node<<BR>><<BR>> {{attachment:files2.gif}} 1. If you select the third button "Time-frequency", you would see "0" everywhere because there are no time-frequency decompositions in the database yet.<<BR>><<BR>> {{attachment:files3.gif}} 1. Now clear the list from all the files. You may either right-click on the list (popup menu ''Clear list''), or select all the nodes (holding ''Shift ''or ''Crtl ''key) and then press the ''Delete ''key. 1. Select both files Left/ERF and Right/ERF in the tree (holding ''Ctrl ''key), and put the in Process list. We are going to apply some functions on those two files. You cannot distiguish them after they are dropped in the list, because they are both referred as "ERP". If at some point you need to know what is in the list, just leave you mouse over a node for a few seconds, and a tooltip would give you information about it. Just like in the database explorer.<<BR>><<BR>> {{attachment:files4.gif}} |
| Line 8: | Line 15: |
| == How does it work ? == == Next == This is the end of the first tutorial, based on CTF MEG recordings. |
== Creating a pipeline == == Plugin structure == The available processes are organized in a plug-in structure. Any Matlab script that is added to the plug-in folder and has the right format will be automatically detected and made available in the GUI. This mechanism makes the contribution from other developers to Brainstorm very easy. |
| Line 12: | Line 19: |
| Other important notions are going to be introduced in a tutorial based on EEG data : clusters of electrodes, and statistical analysis. But please go again through all the importation / anatomy definition | === User processes === |
Tutorial 9: Processes
The main window includes a graphical batching interface that directly benefits from the database explorer: files are organized as a tree of subjects and conditions, and simple drag-and-drop operations readily select files for subsequent batch processing. Most of the Brainstorm features are (or will be) available through this interface, including pre-processing of the recordings, averaging, time-frequency decompositions, and computing statistics. A full analysis pipeline can be created in a few minutes, saved in the user’s preferences and reloaded in one click, executed directly or exported as a Matlab script.
Selecting files to process
First thing to do is to define the files you are going to process. This is done easily by picking files or folders in the database explorer and droping them in the empty list of the Process1 tab.
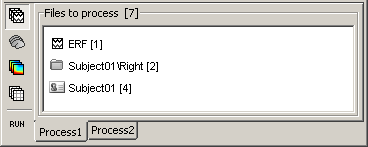
Drag and drop the following nodes in the Process1 list: Right/ERF (recordings), Left (condition), and Subject01 (subject)

- A number between brackets appear next to each node: it represents the number of data files that where found in each of them. The node ERF "contains" only itself (1), Subject01/Right contains ERF and Std files (2), and Subject01 contains 2 conditions x 2 recordings (4).
- The total number of files, ie. the sum of all those values, appears in the title of the panel "Files to process [8]".
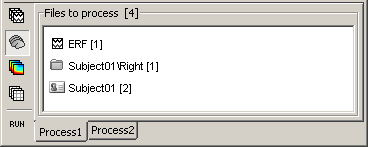
The buttons on the left side allow you to select what type of file you want to process: Recordings, sources, time-frequency, other. Now select the second button "Sources". All the counts are updated and now reflect the number of sources files that are found for each node

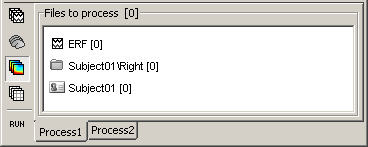
If you select the third button "Time-frequency", you would see "0" everywhere because there are no time-frequency decompositions in the database yet.

Now clear the list from all the files. You may either right-click on the list (popup menu Clear list), or select all the nodes (holding Shift or Crtl key) and then press the Delete key.
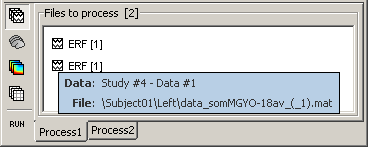
Select both files Left/ERF and Right/ERF in the tree (holding Ctrl key), and put the in Process list. We are going to apply some functions on those two files. You cannot distiguish them after they are dropped in the list, because they are both referred as "ERP". If at some point you need to know what is in the list, just leave you mouse over a node for a few seconds, and a tooltip would give you information about it. Just like in the database explorer.

Creating a pipeline
Plugin structure
The available processes are organized in a plug-in structure. Any Matlab script that is added to the plug-in folder and has the right format will be automatically detected and made available in the GUI. This mechanism makes the contribution from other developers to Brainstorm very easy.
