|
Size: 2255
Comment:
|
Size: 16565
Comment:
|
| Deletions are marked like this. | Additions are marked like this. |
| Line 1: | Line 1: |
| = Human Connectome Project: MEG = '''[WARNING: Tutorial under construction, not ready for public use]''' |
= Human Connectome Project: Resting-state MEG = ''Authors: Francois Tadel, Guiomar Niso, Elizabeth Bock, Sylvain Baillet '' |
| Line 4: | Line 4: |
| ''Authors: Francois Tadel'' This tutorial introduces how to download MEG recordings from the [[http://www.humanconnectome.org/about/project/MEG-and-EEG.html|Human Connectome Project]] (HCP) [[https://db.humanconnectome.org|ConnectomeDB]] database and process them into Brainstorm. |
This tutorial explains how to download MEG recordings from the [[http://www.humanconnectome.org/about/project/MEG-and-EEG.html|Human Connectome Project]] (HCP) [[https://db.humanconnectome.org|ConnectomeDB]] database and process them into Brainstorm. The original processing pipeline was described in [[http://www.sciencedirect.com/science/article/pii/S1053811913005508|this article]] and this [[http://www.humanconnectome.org/documentation/MEG1/MEG1_Release_Reference_Manual.pdf|reference manual]]. Here we will focus only on reproducing the results on resting MEG recordings presented in the [[http://neuroimage.usc.edu/brainstorm/Tutorials/RestingOmega|OMEGA tutorial]]. |
| Line 9: | Line 7: |
The processing pipeline is published in this article:<<BR>>Niso G, Tadel F, Bock E, Cousineau M, Santos A, Baillet S, [[https://www.frontiersin.org/articles/10.3389/fnins.2019.00284/abstract|Brainstorm Pipeline Analysis of Resting-State Data from the Open MEG Archive]], Frontiers in Neuroscience, Mar 2019 |
|
| Line 19: | Line 19: |
| == Presentation of the experiment == ==== Experiment ==== * 1 subject x 6 minute resting session * Supine position * Eyes open with a red fixation cross in a darkened room ==== MEG acquisition ==== * Acquisition at '''2035Hz''', with whole head MAGNES 3600 ('''4D Neuroimaging''') system housed in a magnetically shielded room with 248 magnetometer channels * Recorded at the Saint Louis University (SLU) medical campus * Anti-aliasing low-pass filter at 400Hz * Recorded channels (at least 287): * 23 MEG reference sensors * 248 MEG axial gradiometers * 1 ECG bipolar (#278, #283) * 1 vertical EOG bipolar (#279, #284) * 1 horizontal EOG bipolar (#280, #285) * 4 EMG: left foot (#281), left hand (#282), right foot (#286), right hand (#287) * Noise recordings (empty room) are acquired just before the subject recordings. ==== Head shape and fiducial points ==== * 3D digitization using a Polhemus FASTRAK-III (head localization coils and head shape). * But the 4D file "hs_file" was removed from the distributed package ([[http://neuroimage.usc.edu/brainstorm/Tutorials/HCP-MEG#Import_the_anatomy|see note below]]). |
|
| Line 20: | Line 44: |
| We will use only one subject available in the HCP-MEG2 distribution: subject #'''175237'''. * First, make sure you have at least '''20Gb''' of free space on your hard drive. * Login in or create an account on the [[https://db.humanconnectome.org/app/template/Login.vm|ConnectomeDB website]]. * In section "WU-Minn HCP Data - 1200 Subjects", select "Explore subjects > MEG subjects" <<BR>><<BR>> {{attachment:connectomedb1.gif||width="685",height="204"}} * In tab "Subject information", navigate until you find subject '''175237'''. <<BR>><<BR>> {{attachment:connectomedb2.gif||width="685",height="126"}} * Click on it, then click on button "Download images". <<BR>><<BR>> {{attachment:connectomedb3.gif||width="687",height="151"}} * Navigate in the available recordings and click on "Queue for download" for the following packages: ('''Session Type > Processing Level > Package Name''') * 3T MRI > Unprocessed > Structural unprocessed * MEG > Unprocessed > Noise * MEG > Unprocessed > Resting state * MEG > Preprocessed > Anatomy * Click on "Download packages" > "Download now" > Follow the instructions. <<BR>><<BR>> {{attachment:connectomedb4.gif||width="680",height="63"}} * Unzip all the downloaded files in the same folder. Note that this folder should not be in any of the Brainstorm folders (program folder or database folder). The unzipped files will be arranged as: {{attachment:connectomedb4.gif||width="680",height="63"}} {{{#!wiki note If you [download HCP data though the via AWS](https://wiki.humanconnectome.org/display/PublicData/How+To+Connect+to+Connectome+Data+via+AWS), be aware that the files are under the ```HCP_1200``` directory }}} * Start Brainstorm (Matlab scripts or stand-alone version). For help, see the [[http://neuroimage.usc.edu/brainstorm/Installation|Installation]] page. * Select the menu File > Create new protocol. Name it "'''TutorialHcp'''" and select the options: * "No, use individual anatomy", * "No, use one channel file per condition". == Import the anatomy == Create a new subject and import the anatomy, partly processed with the HCP megconnectome v3 scripts. * Select the menu File > New subject > Subject name: '''175237''' <<BR>><<BR>> {{attachment:newsubj.gif||width="392",height="272"}} * In the anatomy view, right-click on the subject folder > Import anatomy folder:<<BR>>File format: HCP MEG/anatomy (pipeline v3)<<BR>>File name: HCP/175237/MEG/anatomy <<BR>><<BR>> {{attachment:import_anat.gif||width="559",height="186"}} * The head surface (generated by Brainstorm) and the cortex surface (imported from the anatomy folder) are shown at the end of the process. You can also display the MRI of the subject. <<BR>><<BR>> {{attachment:anat_surfaces.gif||width="373",height="173"}} {{attachment:anat_mri.gif||width="180",height="173"}} * The position of the anatomical landmarks (NAS, LPA, RPA) may not match exactly the subject's head, they are just set to standard positions in BTi coordinates (equivalent to SCS coordinates in Brainstorm). Same for the AC/PC points, which are defined in MNI coordinates (the linear MNI normalization is computed with the [[http://neuroimage.usc.edu/brainstorm/CoordinateSystems#MNI_coordinates|SPM function spm_maff8]]). * All the information allowing the identification of the subject has been removed from the dataset: the digitized head shape and the positions of the anatomical landmarks are not distributed, and the facial features have been blurred in the MRI. It is therefore impossible to coregister accurately the MRI and the position of the MEG sensors. * The FieldTrip team computed this registration with their tools and distribute only the final transformation matrix (MEG/anatomy/*_MEG_anatomy_transform.txt). This matrix is imported automatically here and gives good results, but unfortunately we cannot reproduce or double-check the quality of the registration. == Access the recordings == Link the resting MEG recordings to the Brainstorm database and run some basic quality control. * Switch to the functional view of the protocol (second button above the database explorer). * Right-click on the subject > Review raw file: <<BR>> File format: MEG/EEG: 4D-Neuroimaging/BTi <<BR>>File name: /175237/unprocessed/MEG/3-Restin/4D/c,rfDC<<BR>><<BR>> {{attachment:meg_link.gif||width="550",height="164"}} * File name: /175237/unprocessed/MEG/3-Restin/4D/c,rfDC * There are no events to read for these resting recordings, do not select any technical track: <<BR>><<BR>> {{attachment:meg_noevt.gif||width="356",height="142"}} * The registration MEG-MRI looks good (grey=head from the MRI, yellow=inside of the MEG helmet): <<BR>><<BR>> {{attachment:meg_coreg.gif||width="370",height="158"}} * Repeat the same operation with file containing the MEG room noise: <<BR>>Review raw file: /175237/unprocessed/MEG/'''1-Rnoise'''/4D/c,rfDC <<BR>><<BR>> {{attachment:meg_noise.gif||width="359",height="157"}} * The registration looks wrong, but this is normal: there is no subject in the MEG. * In Process1, drag and drop the two links to resting and noise recordings. * Run process: '''Frequency >''' '''Power spectrum density (Welch)''': All file, 4s, 50% overlap, Individual. <<BR>><<BR>> {{attachment:psd_process.gif||width="411",height="246"}} * Check the quality of the PSD for all the files, as documented in [[http://neuroimage.usc.edu/brainstorm/Tutorials/ArtifactsFilter#Interpretation_of_the_PSD|this tutorial]]. The sensor A244 looks extremely noisy compared with all the others, and others are suspicious (A227, A246, A248). We will mark them all as bad. <<BR>><<BR>> {{attachment:psd_display.gif||width="406",height="203"}} * Double-click on the link to open the rest recordings, select the montage "4D 218-248". * In the Record tab, select the button [Display mode for time series]. * Select the bad channels (227, 244, 246, 248), right-click > Channels > '''Mark selected as bad'''. <<BR>><<BR>> {{attachment:bad_a244.gif||width="529",height="206"}} == Pre-processing == Apply frequency filters to the recordings. * In Process1, keep the same files selected and click on [Run]. * Select process: '''Pre-process >''' '''Notch filter''': 60 120 180 240 300 Hz, Process the entire file at once * Add process: '''Pre-process >''' '''Band-pass filter''': High-pass filter at 0.3Hz, 60dB, Process entire file. * Add process: '''Frequency >''' '''Power spectrum density (Welch)''': Same options <<BR>><<BR>> {{attachment:filter_process.gif||width="509",height="343"}} * Run, then check the PSD after filtering. * Delete the folders corresponding to the original recordings (1-Rnoise, 3-Restin) and the notch filtered data (_notch). Only keep the fully processed files (_notch_high). <<BR>><<BR>> {{attachment:psd_after.gif||width="585",height="175"}} <<TAG(Advanced)>> == Auxiliary channels == The ECG, VEOG and HEOG are available in the recordings in the form of bipolar montages. For each of them, we have access to two channels that need to be subtracted before being visualized or used for artifact detection. If you display the EOG channels, you will observe something like this: . {{attachment:eog_bipolar.gif||width="448",height="114"}} To display these channels properly you can create the following montage, with the help of the [[http://neuroimage.usc.edu/brainstorm/Tutorials/MontageEditor#Custom_montage|Montage editor]] tutorial. . {{attachment:eog_montage.gif||width="635",height="182"}} == Artifact cleaning == We will now run the automatic procedure for cleaning the heartbeats, as described in the introduction tutorials ([[http://neuroimage.usc.edu/brainstorm/Tutorials/ArtifactsDetect|detection]], [[http://neuroimage.usc.edu/brainstorm/Tutorials/ArtifactsSsp|SSP]]). The results we want to illustrate here are robust enough, the recordings do not need to be processed any further. If you want to improve the quality of the data with more manual cleaning (blinks, saccades, movements, bad segments), please refer to the introduction tutorials. * Double-click on the resting recordings to open the MEG signals. * In the Record tab, select menu: '''Artifacts > Detect heartbeats''': <<BR>>Channel name: "'''ECG+, -ECG-'''" (bipolar montage), All file, cardiac <<BR>><<BR>> {{attachment:ecg_detect.gif||width="555",height="187"}} * In the Record tab, select menu: '''Artifacts > SSP: Heartbeats''': cardiac, MEG, Use existing SSP <<BR>>Run, evaluate the components, select the first one after making sure it removes the cardiac peaks. <<BR>><<BR>> {{attachment:ssp_ecg.gif||width="580",height="181"}} == Source estimation == * In Process1, select the noise recordings ('''1-Rnoise'''). * Run process: '''Sources > Compute covariance''': All file, Noise covariance, Copy to other folders.<<BR>> {{attachment:noisecov_process.gif|noiscov_process.gif|width="484",height="455"}} * In Process1, select the subject rest recordings ('''3-Restin'''). * Run process: '''Sources > Compute head model''': Cortex surface, MEG=Overlapping spheres. <<BR>><<BR>> {{attachment:headmodel_process.gif||width="488",height="432"}} * Run process: '''Sources > Compute sources [2016]''': Kernel only, one per file, dSPM, constrained. <<BR>><<BR>> {{attachment:inverse_process.gif||width="600",height="288"}} == Power maps == We have now access to continuous recordings in source space, we can estimate the average power over this resting period, for various frequency bands. We propose here to compute the PSD from the first 100s instead of the full 379s rest recordings, it is faster and leads to very similar results. For more stable estimates, you can compute the the PSD over all the data available instead. * In Process1, select the sources for the subject rest recordings ('''3-Restin''') * Select process: '''Frequency > Power spectrum density (Welch)''': [0,100s], Window=4s, 50% overlap, Group in frequency bands (use the default frequency bands), Save individual PSD values. * Add process: '''Standardize > Spectrum normalization''': Relative power (divide by total power). This normalization is done independently for each source, the output for each frequency band is a percentage of how much this frequency band contributes to the total power of the source signal. * Add process: '''Sources > Spatial smoothing''': FWHM=3mm, Overwrite. <<BR>><<BR>> {{attachment:psd_sources_process.gif||width="614",height="369"}} <<BR>><<BR>> {{attachment:psd_sources_normalize.gif||width="576",height="299"}} * Double-click on the average to display it. To create the figures below, right-click on the figure > Snapshot > Frequency contact sheet. <<BR>> {{attachment:psd_sources_left.gif||width="331",height="132"}} {{attachment:psd_sources_top.gif||width="285",height="181"}} * These figures are very similar to what was presented in the in the [[http://neuroimage.usc.edu/brainstorm/Tutorials/RestingOmega#Power_maps|OMEGA tutorial]], just noisier because they are based on a single subject instead of an average. Please refer to it for the interpretation of the results. * You can compute the same results in the head volume. You just have to use a volume head model on a group grid instead of the one we used here. This is explained in the tutorial [[http://neuroimage.usc.edu/brainstorm/Tutorials/CoregisterSubjects#Volume_source_models|Group analysis]]. This seems to confirm that the power in the delta band is mostly coming from non-brain regions (eyes). <<BR>><<BR>> {{attachment:psd_volume_delta.gif||width="254",height="238"}} * You can produce similar plots at the sensor level: Compute the PSD by frequency band of the rest recordings for each subject. <<BR>><<BR>> {{attachment:psd_sensors.gif||width="578",height="169"}} == References == * [[https://db.humanconnectome.org|ConnectomeDB]] * [[http://www.humanconnectome.org/documentation/S500/index.html|500 Subjects + MEG2 Data Release Reference]] * [[http://www.sciencedirect.com/science/article/pii/S1053811913005508|HCP-MEG NeuroImage article]] * [[http://www.humanconnectome.org/documentation/HCP-pipelines/meg-pipeline.html|MEG Pipeline Reference (megconnectome v3)]] * [[http://www.humanconnectome.org/documentation/MEG1/MEG1_Release_Reference_Manual.pdf|MEG1 release reference manual]] |
|
| Line 26: | Line 171: |
Human Connectome Project: Resting-state MEG
Authors: Francois Tadel, Guiomar Niso, Elizabeth Bock, Sylvain Baillet
This tutorial explains how to download MEG recordings from the Human Connectome Project (HCP) ConnectomeDB database and process them into Brainstorm. The original processing pipeline was described in this article and this reference manual. Here we will focus only on reproducing the results on resting MEG recordings presented in the OMEGA tutorial.
Note that the operations used here are not detailed, the goal of this tutorial is not to introduce Brainstorm to new users. For in-depth explanations of the interface and theoretical foundations, please refer to the introduction tutorials.
The processing pipeline is published in this article:
Niso G, Tadel F, Bock E, Cousineau M, Santos A, Baillet S, Brainstorm Pipeline Analysis of Resting-State Data from the Open MEG Archive, Frontiers in Neuroscience, Mar 2019
Contents
License
These data were generated and made available by the Human Connectome Project, WU-Minn Consortium (Principal Investigators: David Van Essen and Kamil Ugurbil; 1U54MH091657), which is funded by the 16 NIH Institutes and Centers that support the NIH Blueprint for Neuroscience Research and by the McDonnell Center for Systems Neuroscience at Washington University.
For additional information on how to acknowledge HCP and cite HCP publications if you have used data provided by the WU-Minn HCP consortium, see http://www.humanconnectome.org/citations.
As a reminder, users of these datasets must comply with the Data Use Terms that were agreed upon when receiving these data.
Presentation of the experiment
Experiment
- 1 subject x 6 minute resting session
- Supine position
- Eyes open with a red fixation cross in a darkened room
MEG acquisition
Acquisition at 2035Hz, with whole head MAGNES 3600 (4D Neuroimaging) system housed in a magnetically shielded room with 248 magnetometer channels
- Recorded at the Saint Louis University (SLU) medical campus
- Anti-aliasing low-pass filter at 400Hz
- Recorded channels (at least 287):
- 23 MEG reference sensors
- 248 MEG axial gradiometers
- 1 ECG bipolar (#278, #283)
- 1 vertical EOG bipolar (#279, #284)
- 1 horizontal EOG bipolar (#280, #285)
- 4 EMG: left foot (#281), left hand (#282), right foot (#286), right hand (#287)
- Noise recordings (empty room) are acquired just before the subject recordings.
Head shape and fiducial points
- 3D digitization using a Polhemus FASTRAK-III (head localization coils and head shape).
But the 4D file "hs_file" was removed from the distributed package (see note below).
Download and installation
We will use only one subject available in the HCP-MEG2 distribution: subject #175237.
First, make sure you have at least 20Gb of free space on your hard drive.
Login in or create an account on the ConnectomeDB website.
In section "WU-Minn HCP Data - 1200 Subjects", select "Explore subjects > MEG subjects"

In tab "Subject information", navigate until you find subject 175237.

Click on it, then click on button "Download images".

Navigate in the available recordings and click on "Queue for download" for the following packages: (Session Type > Processing Level > Package Name)
3T MRI > Unprocessed > Structural unprocessed
MEG > Unprocessed > Noise
MEG > Unprocessed > Resting state
MEG > Preprocessed > Anatomy
Click on "Download packages" > "Download now" > Follow the instructions.

- Unzip all the downloaded files in the same folder. Note that this folder should not be in any of the Brainstorm folders (program folder or database folder).
- The unzipped files will be arranged as:

If you [download HCP data though the via AWS](https://wiki.humanconnectome.org/display/PublicData/How+To+Connect+to+Connectome+Data+via+AWS), be aware that the files are under the HCP_1200 directory
- The unzipped files will be arranged as:
Start Brainstorm (Matlab scripts or stand-alone version). For help, see the Installation page.
Select the menu File > Create new protocol. Name it "TutorialHcp" and select the options:
- "No, use individual anatomy",
- "No, use one channel file per condition".
Import the anatomy
Create a new subject and import the anatomy, partly processed with the HCP megconnectome v3 scripts.
Select the menu File > New subject > Subject name: 175237
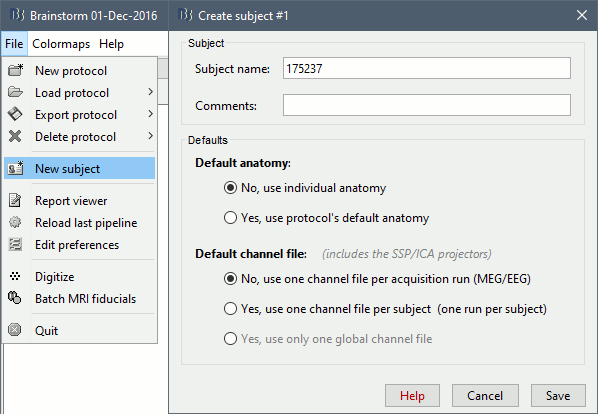
In the anatomy view, right-click on the subject folder > Import anatomy folder:
File format: HCP MEG/anatomy (pipeline v3)
File name: HCP/175237/MEG/anatomy

The head surface (generated by Brainstorm) and the cortex surface (imported from the anatomy folder) are shown at the end of the process. You can also display the MRI of the subject.
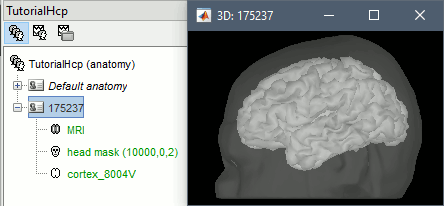
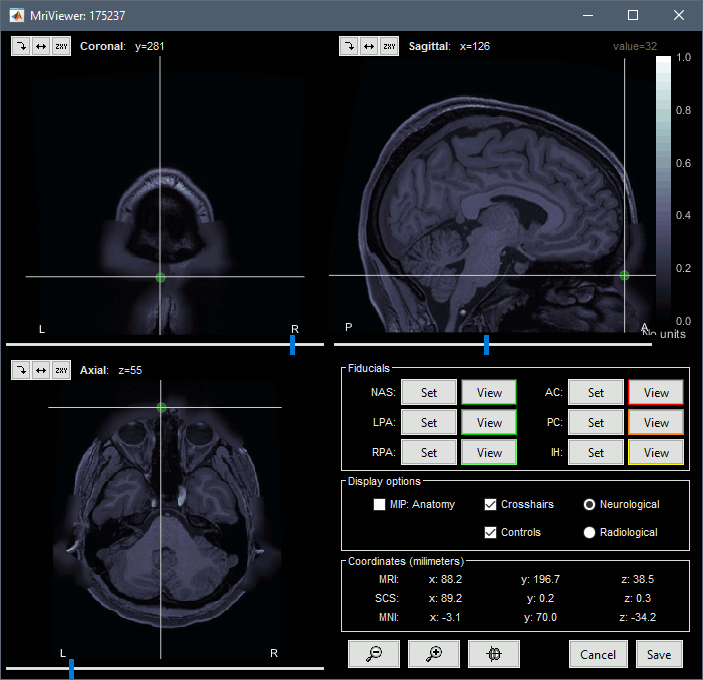
The position of the anatomical landmarks (NAS, LPA, RPA) may not match exactly the subject's head, they are just set to standard positions in BTi coordinates (equivalent to SCS coordinates in Brainstorm). Same for the AC/PC points, which are defined in MNI coordinates (the linear MNI normalization is computed with the SPM function spm_maff8).
- All the information allowing the identification of the subject has been removed from the dataset: the digitized head shape and the positions of the anatomical landmarks are not distributed, and the facial features have been blurred in the MRI. It is therefore impossible to coregister accurately the MRI and the position of the MEG sensors.
The FieldTrip team computed this registration with their tools and distribute only the final transformation matrix (MEG/anatomy/*_MEG_anatomy_transform.txt). This matrix is imported automatically here and gives good results, but unfortunately we cannot reproduce or double-check the quality of the registration.
Access the recordings
Link the resting MEG recordings to the Brainstorm database and run some basic quality control.
- Switch to the functional view of the protocol (second button above the database explorer).
Right-click on the subject > Review raw file:
File format: MEG/EEG: 4D-Neuroimaging/BTi
File name: /175237/unprocessed/MEG/3-Restin/4D/c,rfDC

- File name: /175237/unprocessed/MEG/3-Restin/4D/c,rfDC
There are no events to read for these resting recordings, do not select any technical track:
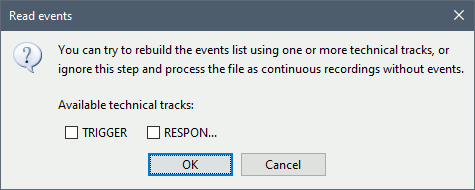
The registration MEG-MRI looks good (grey=head from the MRI, yellow=inside of the MEG helmet):
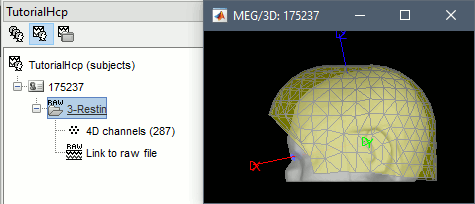
Repeat the same operation with file containing the MEG room noise:
Review raw file: /175237/unprocessed/MEG/1-Rnoise/4D/c,rfDC
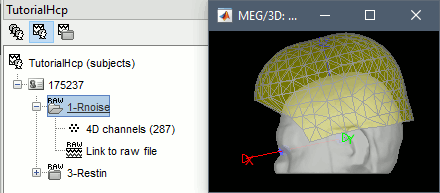
- The registration looks wrong, but this is normal: there is no subject in the MEG.
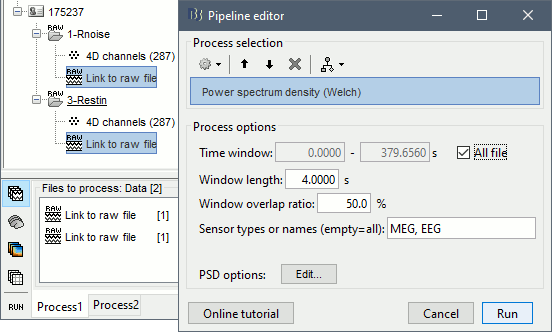
- In Process1, drag and drop the two links to resting and noise recordings.
Run process: Frequency > Power spectrum density (Welch): All file, 4s, 50% overlap, Individual.
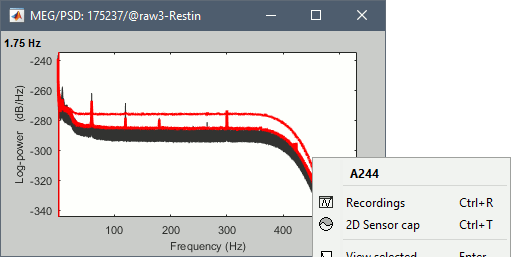
Check the quality of the PSD for all the files, as documented in this tutorial. The sensor A244 looks extremely noisy compared with all the others, and others are suspicious (A227, A246, A248). We will mark them all as bad.
- Double-click on the link to open the rest recordings, select the montage "4D 218-248".
- In the Record tab, select the button [Display mode for time series].
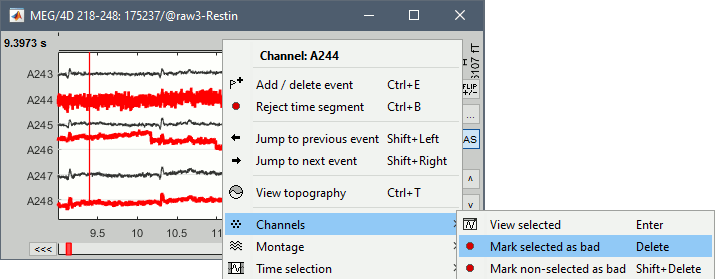
Select the bad channels (227, 244, 246, 248), right-click > Channels > Mark selected as bad.
Pre-processing
Apply frequency filters to the recordings.
- In Process1, keep the same files selected and click on [Run].
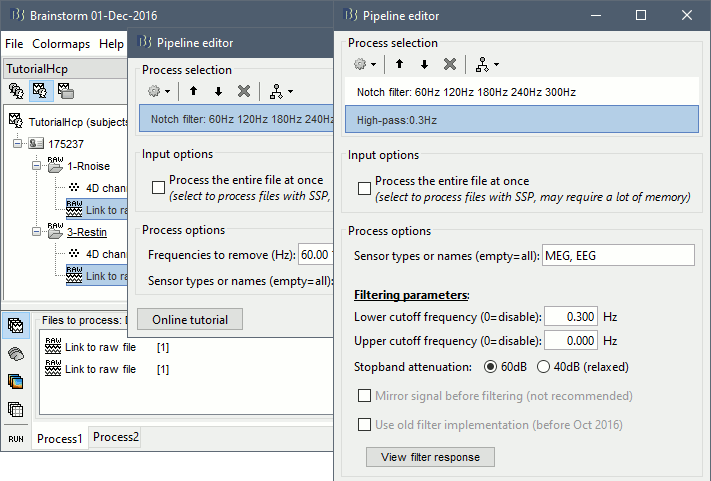
Select process: Pre-process > Notch filter: 60 120 180 240 300 Hz, Process the entire file at once
Add process: Pre-process > Band-pass filter: High-pass filter at 0.3Hz, 60dB, Process entire file.
Add process: Frequency > Power spectrum density (Welch): Same options
- Run, then check the PSD after filtering.
Delete the folders corresponding to the original recordings (1-Rnoise, 3-Restin) and the notch filtered data (_notch). Only keep the fully processed files (_notch_high).

Auxiliary channels
The ECG, VEOG and HEOG are available in the recordings in the form of bipolar montages. For each of them, we have access to two channels that need to be subtracted before being visualized or used for artifact detection. If you display the EOG channels, you will observe something like this:
To display these channels properly you can create the following montage, with the help of the Montage editor tutorial.
Artifact cleaning
We will now run the automatic procedure for cleaning the heartbeats, as described in the introduction tutorials (detection, SSP). The results we want to illustrate here are robust enough, the recordings do not need to be processed any further. If you want to improve the quality of the data with more manual cleaning (blinks, saccades, movements, bad segments), please refer to the introduction tutorials.
- Double-click on the resting recordings to open the MEG signals.
In the Record tab, select menu: Artifacts > Detect heartbeats:
Channel name: "ECG+, -ECG-" (bipolar montage), All file, cardiac
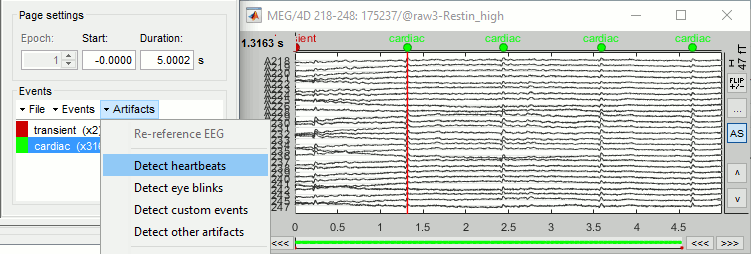
In the Record tab, select menu: Artifacts > SSP: Heartbeats: cardiac, MEG, Use existing SSP
Run, evaluate the components, select the first one after making sure it removes the cardiac peaks.

Source estimation
In Process1, select the noise recordings (1-Rnoise).
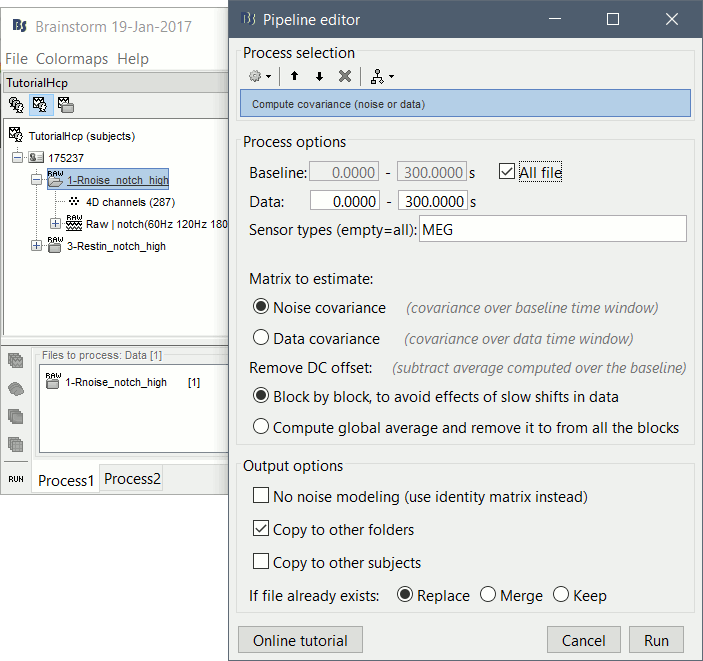
Run process: Sources > Compute covariance: All file, Noise covariance, Copy to other folders.
In Process1, select the subject rest recordings (3-Restin).
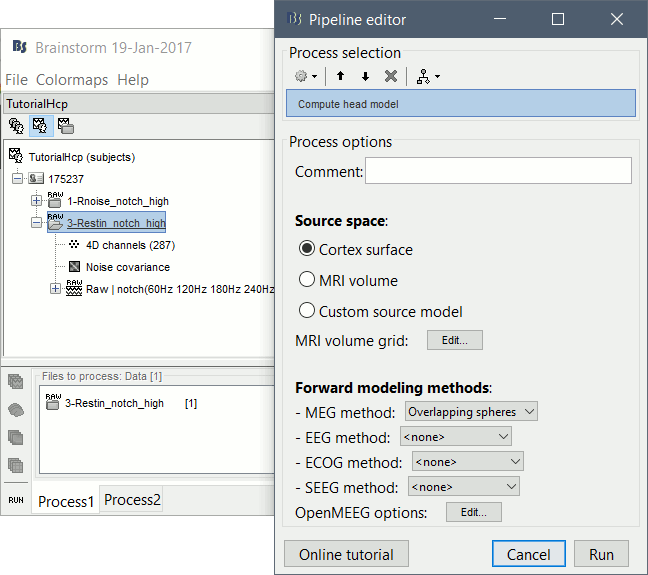
Run process: Sources > Compute head model: Cortex surface, MEG=Overlapping spheres.
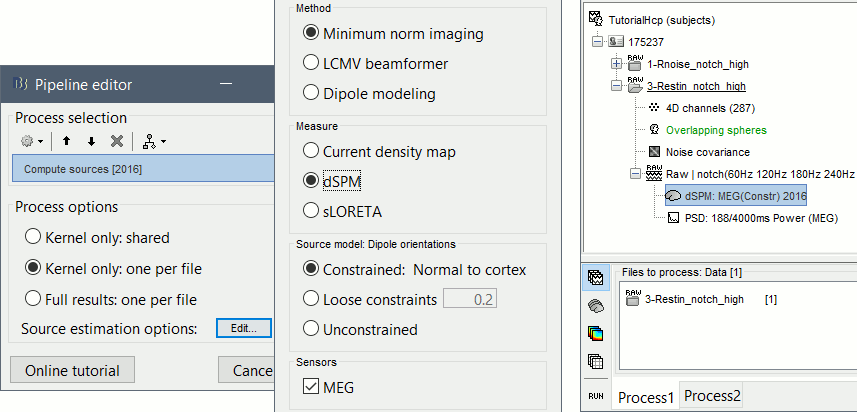
Run process: Sources > Compute sources [2016]: Kernel only, one per file, dSPM, constrained.
Power maps
We have now access to continuous recordings in source space, we can estimate the average power over this resting period, for various frequency bands. We propose here to compute the PSD from the first 100s instead of the full 379s rest recordings, it is faster and leads to very similar results. For more stable estimates, you can compute the the PSD over all the data available instead.
In Process1, select the sources for the subject rest recordings (3-Restin)
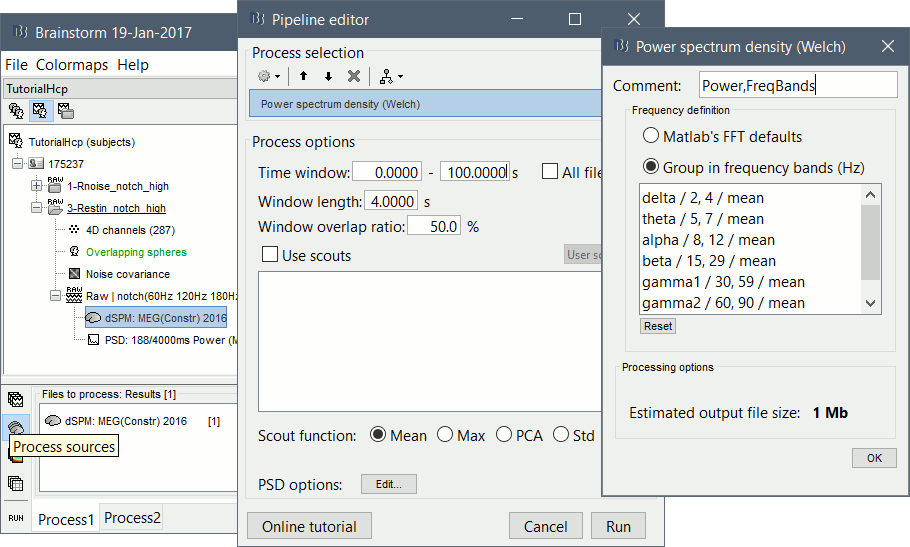
Select process: Frequency > Power spectrum density (Welch): [0,100s], Window=4s, 50% overlap, Group in frequency bands (use the default frequency bands), Save individual PSD values.
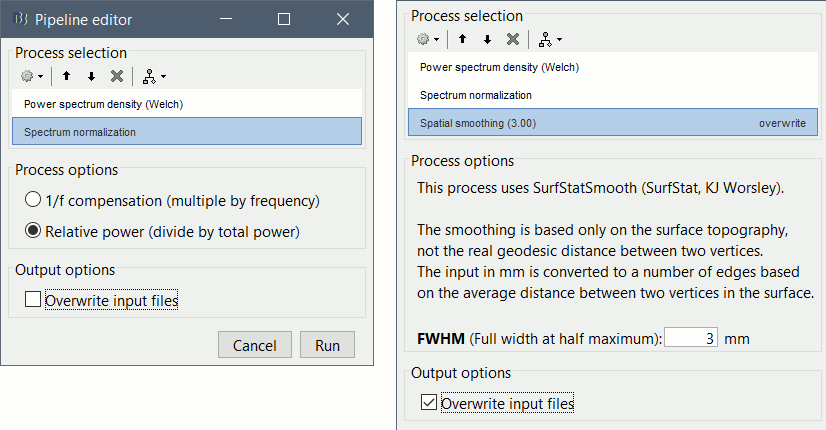
Add process: Standardize > Spectrum normalization: Relative power (divide by total power). This normalization is done independently for each source, the output for each frequency band is a percentage of how much this frequency band contributes to the total power of the source signal.
Add process: Sources > Spatial smoothing: FWHM=3mm, Overwrite.
Double-click on the average to display it. To create the figures below, right-click on the figure > Snapshot > Frequency contact sheet.
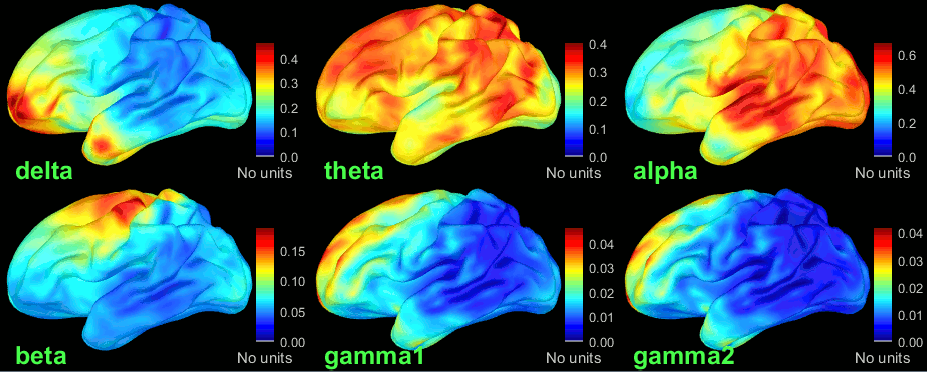
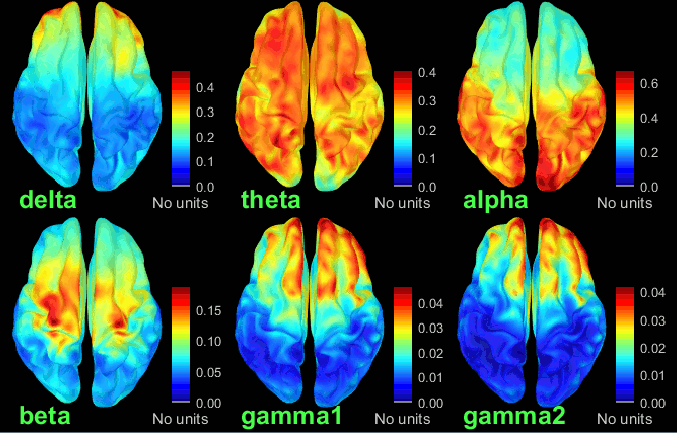
These figures are very similar to what was presented in the in the OMEGA tutorial, just noisier because they are based on a single subject instead of an average. Please refer to it for the interpretation of the results.
You can compute the same results in the head volume. You just have to use a volume head model on a group grid instead of the one we used here. This is explained in the tutorial Group analysis. This seems to confirm that the power in the delta band is mostly coming from non-brain regions (eyes).
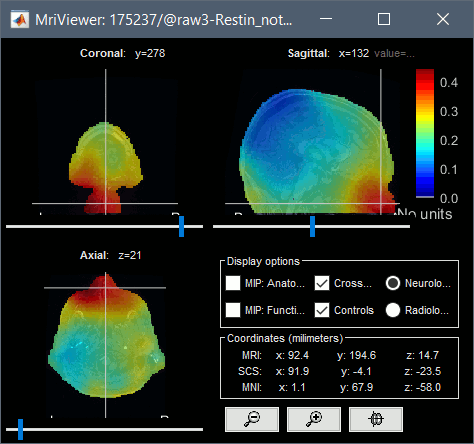
You can produce similar plots at the sensor level: Compute the PSD by frequency band of the rest recordings for each subject.

References
Scripting
The following script from the Brainstorm distribution reproduces the analysis presented in this tutorial page: brainstorm3/toolbox/script/tutorial_hcp.m


