NIRSTORM: Optimizing fNIRS montage
Author: NIRSTORM team
This tutorial explains how to use Optimal Montage in NIRSTORM optimizing the fNIRS montage sensitivity to target specific regions of interest along the cortical surface.
Citation
If you are using the optimal montage within NIRSTORM, please cite the following articles:
- NIRSTORM:
- Édouard Delaire, Thomas Vincent, Zhengchen Cai, Alexis Machado, Laurent Hugueville, Denis Schwartz, Francois Tadel, Raymundo Cassani, Louis Bherer, Jean-Marc Lina, Mélanie Pélégrini-Issac, Christophe Grova, NIRSTORM: A brainstorm extension dedicated to fNIRS data analysis, advanced 3D reconstructions, and optimal probe design, Neurophoton. 12(2), 025011 (2025), doi: 10.1117/1.NPh.12.2.025011.
- Optimal montage:
- Machado, Alexis, et al. "Optimal optode montage on electroencephalography/functional near-infrared spectroscopy caps dedicated to study epileptic discharges." Journal of biomedical optics 19.2 (2014): 026010-026010.
- Machado, Alexis, et al. "Optimal positioning of optodes on the scalp for personalized functional near-infrared spectroscopy investigations." Journal of neuroscience methods 309 (2018): 91-108.’
- Fluence estimation:
- Fang Q, Boas DA. Monte Carlo Simulation of Photon Migration in 3D Turbid Media Accelerated by Graphics Processing Units. Opt Express. 2009;17(22):20178. doi:10.1364/oe.17.020178
Contents
- Introduction
- Estimation of the fNIRS optimal montage for one selected region
- Computing an optimal montage for multiple regions
- Creating an optimal montage for EEG-FNIRS
- Creating an optimal montage for using a fNIRS cap
-
Personalized optimal montage
- Importing the subject anatomy
- Definition of FluenceRegion and FluenceExclude
- Estimating the subject tissue segmentation
- Estimating the Voronoi volume-to-cortex interpolator
- Projecting a volume onto the cortical surface
- Estimating the fluences for every vertex in the search space using MCXlab
- Computing the optimal montage
- Warning message: Denoise of the sensitivity matrix to remove outliers
- Using coverage constraint
- Reference
Introduction
Setup
- NIRSTORM:
- Using the Brainstorm plug-in system, download the following plugins:
Plugins >fNIRS > NIRSTORM > install (download the core of NIRSTORM package)
- CPLEX:
- CPLEX is a set of tools to perform functional optimization edited by IBM. It is used here to solve the integer programming problem during the optimal montage computation. For license concerns, we cannot bundle the CPLEX library within NIRSTORM.
- Students or academics can download a free copy of CPLEX.
- To download CPLEX:
Visit http://ibm.biz/CPLEXonAI and create an account using your institutional email
- Once logged in, scroll down and click on “software” and then select “ILOG CPLEX Optimization Studio”. Click “download”. A new page will open
- In the search options, select text, and write: "IBM ILOG CPLEX Optimization Studio V12.10 Multiplatform Multilingual eAssembly"
Download "IBM ILOG CPLEX Optimization Studio V12.10 for X Multiplatform Multilingual". Replace X with your operating system (e.g. Windows, Linux, MacOs)
Installation of CPLEX
For macOS, install CPLEX using the download installer. For Linux/Windows, unzip the downloaded file in your Documents folder.
Finally, add the path to the CPLEX Matlab folder to the Matlab path:
- In MATLAB, go to the "Home" tab
- Click "Set path" (yellow folder icon)
- Click on "Add with subfolders" and select the folder of the CPLEX Matlab bindings. (For example: "/Applications/CPLEX_Studio1210/cplex/matlab/x86-64_osx")
Note: In Mac, this folder is in your application folder.
Note: If you use a Mac with the Apple Silicon chip (M1 or newer), we recommend using a version of Matlab older than 2023b. This tutorial was tested on Matlab 2021b.
Theoretical introduction to the concept of fNIRS optimal montage
The optimal montage consists of finding the position of the fNIRS optodes on the skin, specifically, pairs of light sources and detectors that will maximize the light sensitivity of the created montage to a predefined targeted region of interest (ROI) on the cortex while respecting a set of user-defined constraints. The region of interest can be defined manually using a priori knowledge, for instance using an anatomical atlas, or using a localization obtained from other modalities (e.g. MEG or EEG source, fMRI response).
To launch the optimal montage tool the user will need to provide the following data:
Anatomical information about the subject to simulate the propagation of the infrared light (also known as fluences) into a realistic head model and estimate the montage sensitivity along the cortex. For the template Colin27 considered in this tutorial, the Fluences have been pre-computed and are automatically downloaded if needed
The targeted region of interest on the cortex: This is a set of vertices on the cortex indicating the region that you want to target when installing fNIRS sensors.
The optode’s possible locations on the skin: this is the set of vertices on the cortex that can be considered for the placement of the optodes. When using a cap, one can use the predefined possible positions on the cap or any set of vertices along the skin surface.
A set of spatial constraints: Several geometrical or functional constraints can be considered to optimize the fNIRS montage, including notably, the number of sources and detectors, the range of distances between two optodes, and the minimum source-detector distance. We also allow the user to specify an "Adjacency constraint" which is the minimum of channels formed by each source, therefore a higher adjacency number will ensure more spatial overlap between fNIRS sensors, which is required for 3D reconstruction.

First of all, to estimate an fNIRS optimal montage targeting a specific region of interest, one needs to estimate the light propagation pattern for every possible optodes location. Those light propagation patterns, also called fluences, can be estimated using MCXlab. MCXlab1 works by simulating the propagation of millions of photons based on the subject tissue segmentation. The fluences have been pre-computed for the template Colin27 (Consult section on “Personalized optimal montage” to see how to compute the fluences). Then, for every pair of sources and detectors within our search space (e.g. skin vertices, predefined positions on a cap), the sensitivity of the created channel to the underlying region of interest is estimated and stored in a matrix called the “Sensitivity matrix”.
Then the optimal montage is found by solving a mixed linear integer problem given specific functional constraints. The optimization problem is formulated as a mixed linear integer programming problem under functional constraints, which is solved in NIRSTORM using IBM ILOG CPLEX Optimization toolbox [2]
For more mathematical details about optimal montage, consult references [3–5]
Preamble
- Start Brainstorm (Matlab scripts or stand-alone version)
Select the menu File > Create new protocol.
Name it "TutorialOptimalMontage" and select the options:
- "No, use individual anatomy",
- "No, use one channel file per acquisition run (MEG/EEG)".
- Switch to the "anatomy" view of the protocol.
Right-click on the TutorialOptimalMontage folder > New subject > Subject01
Right-click on Subject01 > Use template > MNI > Download: Colin27_4NIRS_2024
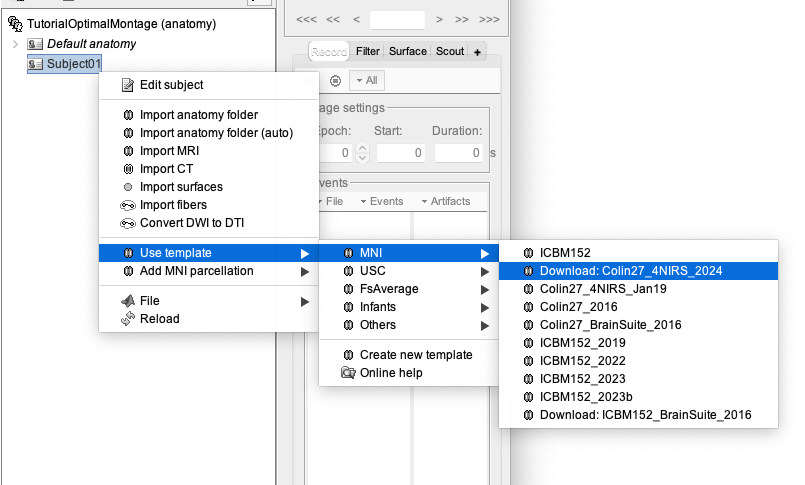
In this tutorial, we are going to design an fNIRS optimal montage targeting a specific ROI, using the Colin27 template as our underlying model of the subject anatomy. The exact same procedure can be applied to a subject’s specific MRI in case you would need to define an optimal montage specifically for every subject[6]. For that, refer to the section "(advanced) Personalized optimal montage".
Estimation of the fNIRS optimal montage for one selected region
Defining the target region along the cortical surface
To create the target ROI along the cortex used for optimal montage, NIRSTORM relies on the Brainstorm concept of scouts. In Brainstorm jargon, a scout represents a region of interest (ROI) in the available cortex. To learn more on how to create a scout, please consult: https://neuroimage.usc.edu/brainstorm/Tutorials/Scouts
The targeted ROI or scout can be manually drawn along the cortical surface, estimated from the analysis of another modality (e.g. EEG or MEG source), or defined using an anatomical atlas. Open the “head” file. Then, on the right side of Brainstorm, you will find the Scout tab. The “User scouts” atlas corresponds to the user-defined regions of interest. You already have two scouts here : FluenceRegion and FluenceExclude. Do not delete them. Close the “head” file.
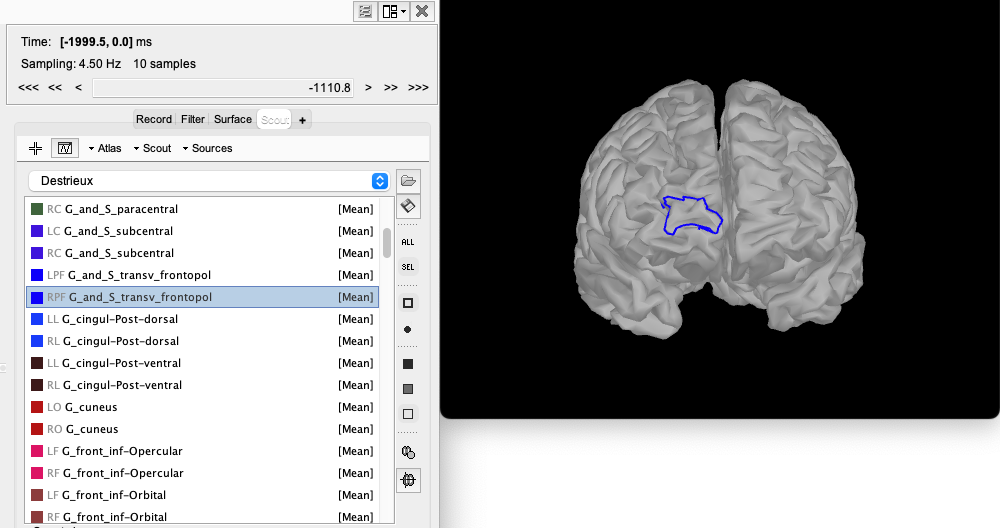
Now, open the mid_15000V. If your preprocessing of anatomical MRI data was done using Freesurfer, you will have access to several anatomical Atlas in Brainstorm (for instance Destrieux, Desikan-Killiany). Same way as before, open the Scout tab. Select the Destrieux atlas instead of “User scouts”.

In this tutorial, we propose to target a right fronto-polar region denoted G_and_S_transv_frontpol R from the Destrieux atlas.
To look at this ROI alone, click on the “SEL” button on the right side of Brainstorm.
Computation of the fNIRS optimal montage
Click on the RUN button, located at the bottom left of Brainstorm and the pipeline editor will appear. Click on the gear icon in the top left corner, then select NIRS > Sources > compute optimal montage.

Set the subject name to “Subject01” and click on Edit.
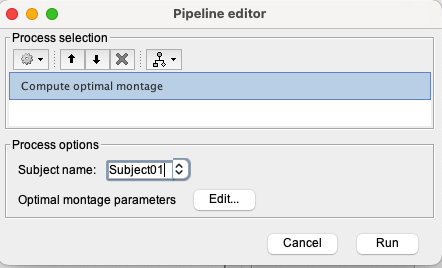
The following panel to enter the option for optimal montage then appears :

- From the left panel:
- Choose the appropriate atlas to define the targeted ROI: "Destrieux" (in case you would like to use a manually defined ROI, you should select “User scouts”) then select the targeted region “G_and_S_transv_frontpol R”.
- Keep the search space as default, and keep the extent of scalp projection to 4cm. This will use all the vertices of the skin surface within a radius of 4 cm around the ROI.
- From the right panel:
- The coverage constraint visible in the figure is not used in this tutorial. If you want to use it, please refer to the advanced part called “Using coverage constraint”.
- (Optional) Specify a folder path to save the weight table.
- Define your montage constraints. In this tutorial, we will keep the default values: 3 sources, 7 detectors, and 7 adjacency numbers, to generate a locally dense montage. For the adjacency number, we recommend the user to estimate and compute montage for different adjacency numbers and evaluate each montage based on the sensitivity, coverage of the ROI, and practicality of the montage setup.
- Specify the path to the fluences, and wavelength used. If you are using the Colin27 template, keep the parameter as default to download the precomputed fluences.
- Specify an output condition name. This is the name that will appear in your Brainstorm database. We recommend to name it "OM_{target_region}_{source}S_{detector}D_{adjacency}A". For example here: OM_ G_and_S_transv_frontpol_R_3S_7D_7A. This will allow you to keep your database organized, especially if you are trying several combinations of several parameters for the optimal montage.
If you do not complete the panel correctly, an error message will appear at the bottom of the panel and the button to validate the panel will not be clickable.

Correct all the indicated errors in order to proceed.
You can now click on run, at the bottom right of the pipeline editor panel. The CPLEX optimisation part will take around 5 minutes.
Once the optimization is done, you will have a report in the Brainstorm report viewer. To open it, go to File > Report viewer:

This shows, for each channel, the source-detector following informations:
- The distance in mm ;
- The sensitivity of the channel to the ROI;
- The coverage is the part of the ROI that is covered.
Nb: You should make sure that the values are reasonable (e.g., there should not be a channel with a weight order of magnitudes larger than the other weights).
In the end, you get an estimate of the total value for these different parameters. You also get an estimation of the overlap value for the whole montage which is important for source reconstruction.
Investigating the light-sensitivity of the resulting montage
This section can be considered to check the spatial properties of any fNIRS montage, whether optimal or not.
Visual inspection
To do the visual inspection, click on the functional data (instead of anatomy) at the top of Brainstorm, under the protocol name.
The first step is to visually check the proposed montage. To do so, in your database, you should now have a folder containing the montage:

Inside the folder, two files are present:
NIRS-BRS channels (21): This contains the information about the montage
Separations: this file contains for each channel, the distance between the source and the detector. The main purpose of this file is to allow you to execute processes on the montage (estimate forward model, extract sensitivity …).
You can inspect the estimated optimal montage by double-clicking on NIRS-BRS channels. This will open a window showing you the NIRS montage (source in red, detector in green). The search space used for the optimal montage appears as a new scout in the "User scouts" panel and is called "From G_and_S_transv_frontpol_R (4cm)". (In general, "From ROI (4 cm)" where ROI is the name of the targeted region on the cortex).
"FluenceRegion" and "FluenceExclude" are two scouts containing information about the possible optodes locations on the head. FluenceRegion indicates all the positions for which we can place optodes and for which we pre-computed the fluences. FluenceExclude contains all the regions for which it is impossible to put optodes (Region near the eye or the ear). FluenceExclude is used internally to avoid the montage overlap with the eyes or ears of the subject.
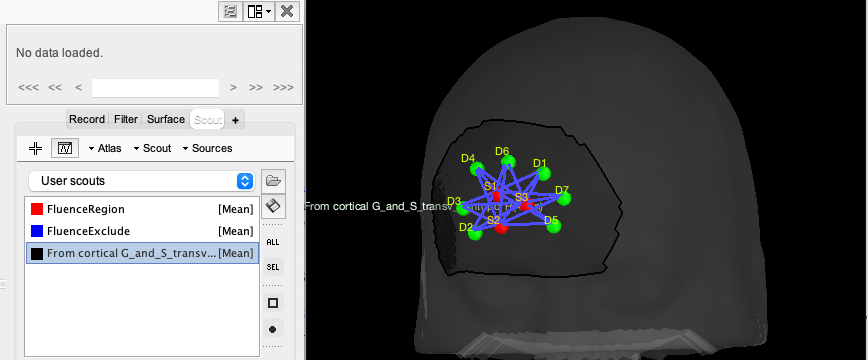
For visualization purposes, you can then add the cortex from the surface menu and see the relation between the montage and the underlying targeted ROI. To do so, click on the add surface button (in the Surface tab, over surface options, on the right side) and select cortex. Then, go to the Scout tab and select “RPF G_and_S_transv_frontopol” and click the “SEL” button on the right side of Brainstorm to display only this scout.

Quantitative inspection
To allow detailed quantitative analysis of our optimal montage, we first need to estimate the fNIRS forward model from the fluences. To do so, drag and drop the separation file into the process box and click on the RUN button at the bottom left of Brainstorm. In the pipeline editor, click on the gear icon in the top left corner, and then select the process NIRS > Sources > compute head model from fluence.

For the fluence data source, use https://neuroimage.usc.edu/resources/nst_data/fluence/. This will use the pre-computed fluences for the Colin27 head model. Keep the other parameters as default. Then click on Run.
Leaving the separations in the files to process box, can now extract the sensitivity of the montage to the cortex using the following process: RUN > Gear icon > NIRS > Sources > Extract sensitivity surfaces from head model.

Once you modified the panel to be the same as the one above, click on run. This will generate the following files:
- Sensitivities – WL {WL value} nm
- Summed sensitivities – WL {WL value} nm
- Coverage – WL {WL value} nm
- Overlap measure – WL {WL value} nm
In this case, this is what you will get:

Summed sensitivities map
This map reports the overall sensitivity of the montage (sum of all the channels). The map is in decibels (dB). A value of 0 represents the maximum sensitivity. A value of -1 indicates 10% of the maximum sensitivity, and a value of -2 indicates 1% of the maximum sensitivity. To use a linear scale, use the option "Linear" when exporting the sensitivity maps.
For better visualization purposes, we recommend the following settings (can be obtained by right-clicking on the map)
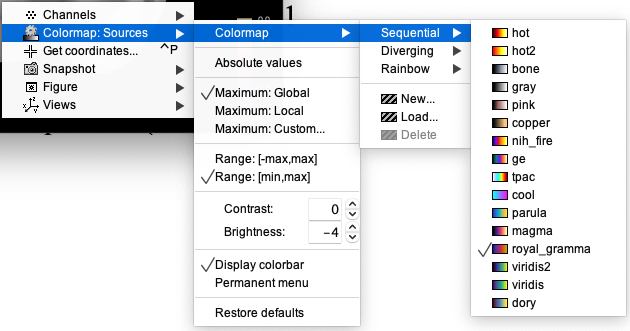
The next maps are spatiotemporal maps, meaning that we encoded some information in the time vector. To navigate those maps, you will need to adjust the selected time from the Brainstorm panel.
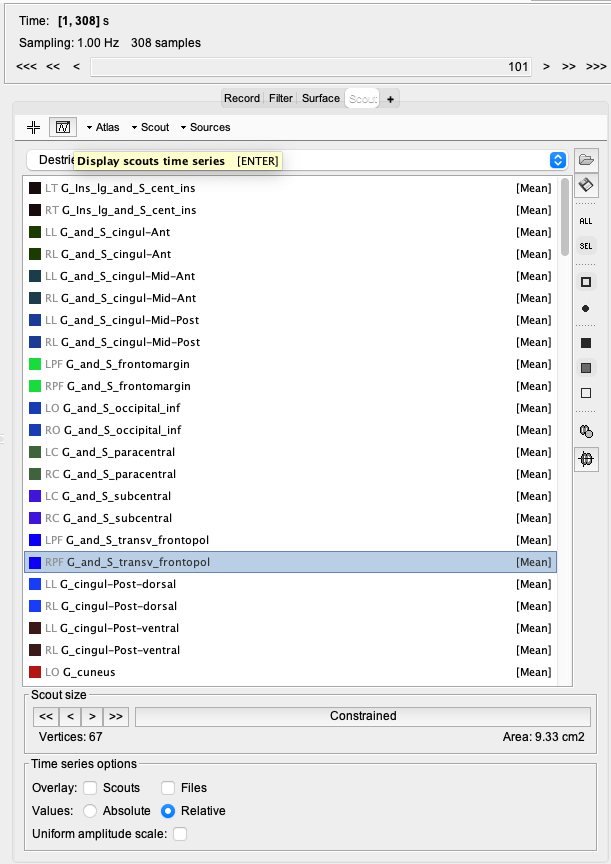
It might also be useful when exploring those maps to visualize the quantity of interest inside specific regions. For that, you can select a scout and use the button "Display scouts time series". You can modify the function applied to each scout to either display the mean over the vertex or all the vertices (one line per vertex). Doing so can be helpful to change the displayed time point on the map.
Sensitivities map
This map reports the light sensitivity of each individual channel, i.e. This is a spatiotemporal map, for which the channel configuration information is encoded along the time vector. So to access the light sensitivity corresponding to the channel SXDY, one needs to visualize the map at the time sample 100*X + Y. Therefore, the sensitivity map of the channel S3D9 is encoded at t = 309s and S2D10 is time t = 210s.
To look at each source-detector sensitivity map, use the upper right part of Brainstorm:

Change the value in the text box. For example, in the image, we are looking at the S1-D1 sensitivity map.

This figure illustrates the light sensitivity map for time 206 (S2D6). The time course shows the average sensitivity inside the target region for each channel. Non-zero values show the existing channels.
NIRSTORM also exports the spatial overlap between channels within the montage: two channels are considered to be overlapping spatially for a specific vertex if they are both sensitive to that specific channel.
Coverage map
This map works exactly like the sensitivities map: Each time represents a channel between one source and one detector. For example, if we take back S2 - D6, we obtain this result:

On this map, you can see the region considered covered by this specific channel if the sensitivity values exceed a certain threshold, corresponding to the color red / purple on the sensitivity map.
Overlap measure
This map gives you the number of channels overlapping on the whole ROI. Region with more overlapping channels will have a more reliable 3D reconstruction.

Exporting the montage coordinate
To export the montage, right-click on “NIRS-BRS channel”, then File, then export to file.
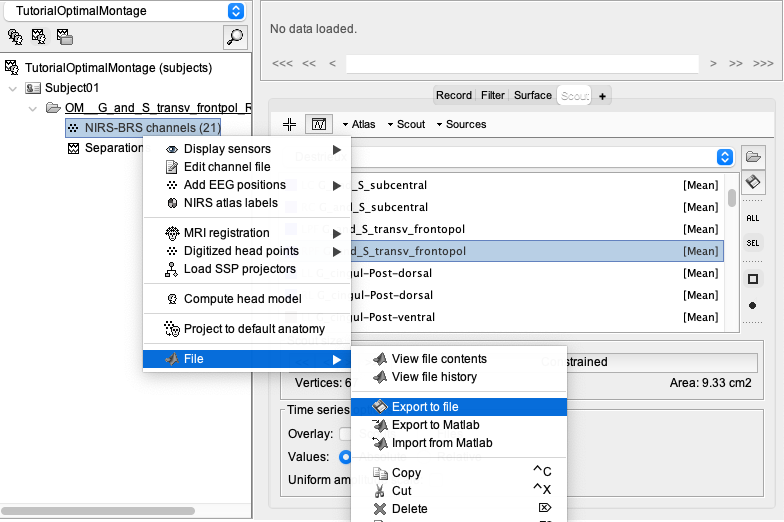
You will then be able to export the optodes coordinate in multiple spaces (subject space, or MNI space) and multiple formats. For more information about the coordinate system, consult: https://neuroimage.usc.edu/brainstorm/CoordinateSystems
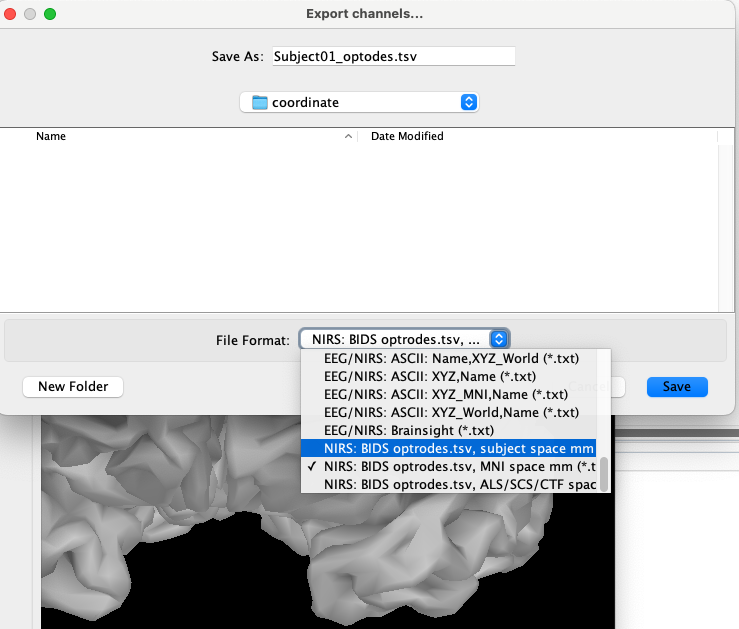
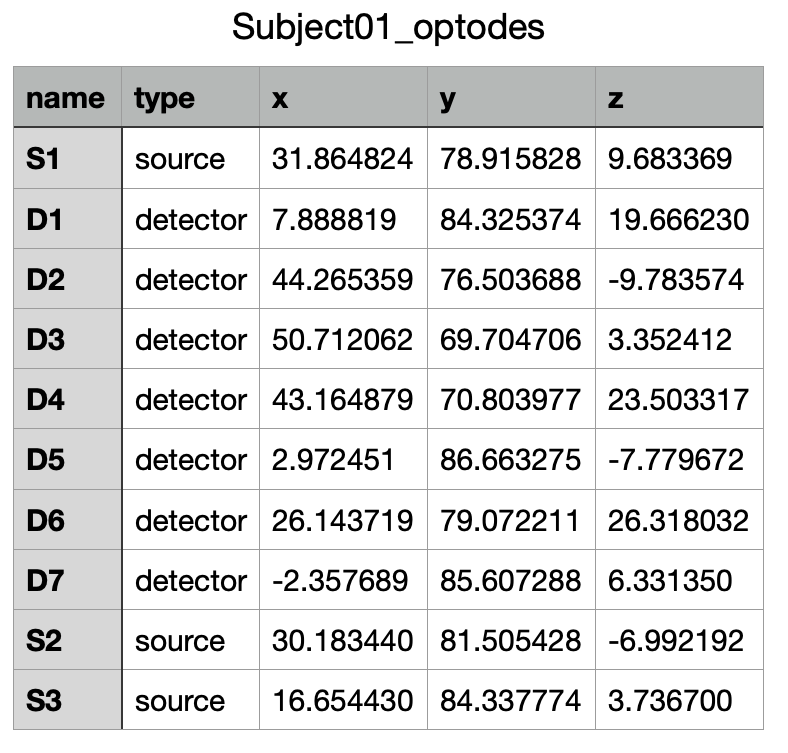
These coordinates can then be reported or imported into a neuronavigation system to guide the installation of the optodes on your subject or for the preparation of your cap.
For example, exporting the coordinate using the “NIRS: BIDS optrodes.tsv, MNI space mm (*.tsv)” will generate the following file:
Computing an optimal montage for multiple regions
The optimal montage is working one region at a time. If your study involves measuring fNIRS over multiple regions, you need to compute the optimal montage for each region separately. The different montages can then be merged before computing the sensitivity of the resulting montage and exporting the optodes coordinates.
Computing optimal montage for each region
The first step consists in estimating the optimal montage for each region separately. Repeating the previous step, we can for instance compute an optimal montage for the region From G_and_S_transv_frontpol_L, which is the contralateral region to the previously investigated region. Using the same parameter (hanging the output name to OM_ G_and_S_transv_frontpol_L_3S_7D_7A).
We obtain the following results :

Merging montages
The next step is to merge the different montages. This is notably useful for detecting conflict between optodes, since launching the optimal montage several times, some optodes might be located too close to each other in the merged montage. NIRSTORM will generate a warning if the distance between two optodes is less than 1.5cm.
To merge montages, drag and drop the "Separations" files to the file to process box, and select the process NIRS > Sources > Merge Montage
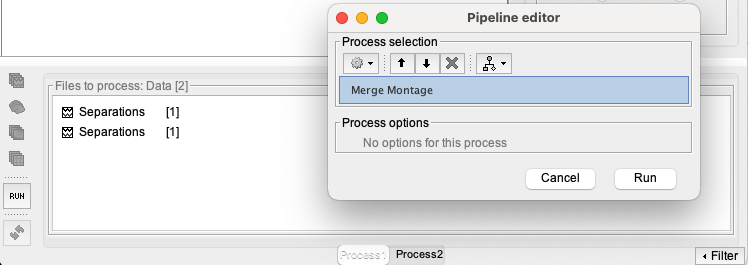
This will generate a new folder in the Brainstorm database called “OM_G_and_S_transv_frontpol_R_7S_7D_7A_merge2” that can be renamed to “OM_G_and_S_transv_frontpol_LR_7S_7D_7A”.
Since our two ROIs were very close to each other, the following warning can be seen in the report viewer:

This warning indicates a conflict between detector 13 and detectors 1 and 7, between detectors 14 and detectors 3 and 7 and between source 4 and detector 7.
If we open the montage, we can indeed see that detector 12 is very close to detectors 7 and 5, and also that detector 13 is close to detectors 1 and 7. The following figure shows a zoom on the merged montage, zoomed on the specific detector showing conflict.

In case of “conflict” between multiple optodes, several options exist to solve them:
- One solution could be to identify the matching detector and to “fuse them”. For example, detectors 1 and 13 can be merged and considered as a unique detector located between D1 and D13.
- The second solution would be to recompute the second optimal montage with a modified search space to avoid conflict with the first ROI (see next section).
- The last solution would be to merge the target ROI on the cortex and recompute one unique optimal montage targeting both ROI at once.
If no conflict arises, you can then compute the same metrics as before and export the coordinates of the montage.
Modifying the search space
So far, we have let the optimal montage choose the search space for the optodes positions. By default, we are considering any vertex of the skin surface at a maximum distance of 4 cm around the ROI as a possible optode position for our optimal montage. In the previous illustration for the merged montage, one solution is to restrict the search space for the second ROI to avoid conflict with the previous montage.
To do so, open the fNIRS montage, and manually create a scout on the head covering all the optodes of the right montage and call it "Exclude" (the name is not important). Here is a tutorial about how to do it : Link to the corresponding Brainstorm tutorial
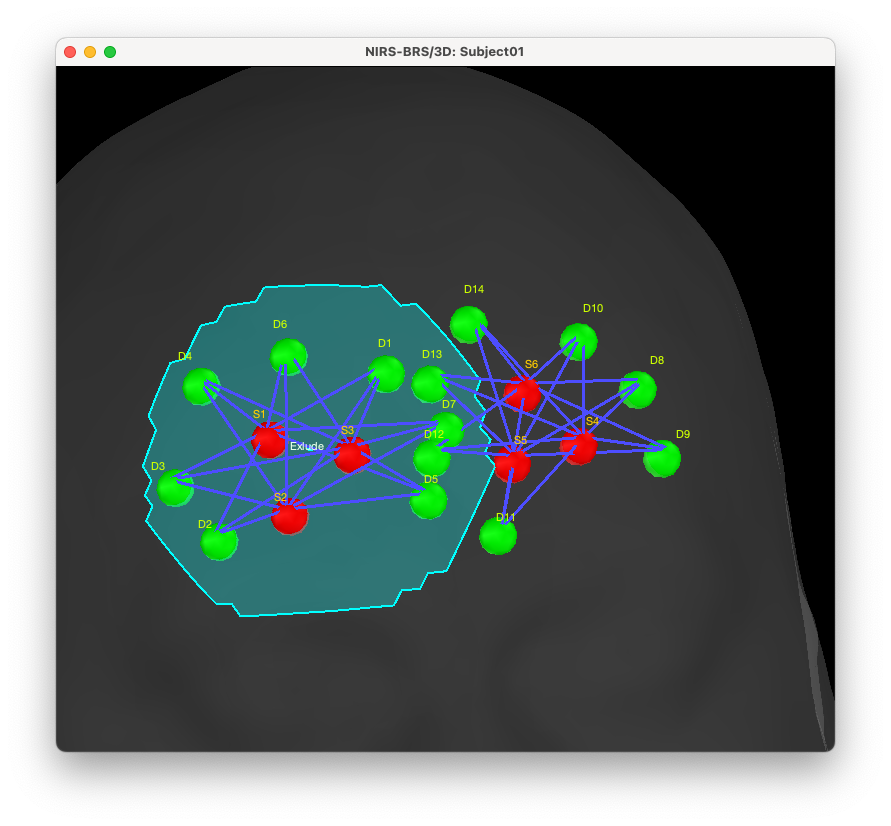
Note that the definition is approximative but should cover most of the left montage, including a boundary of around 1.5 cm around each optode. You can then duplicate the original left search region called “From cortical G_and_S_transv_frontopol L(4 cm)” and rename it region “ROI G_and_S_transv_frontopol L (custom)” (again the exact name is not important).
You can then remove the "exclude" region from this region by using the difference tool in Brainstorm. To do so, just select the scouts “exclude” and “ROI G_and_S_transv_frontopol L (custom)” and then Scout > Difference.
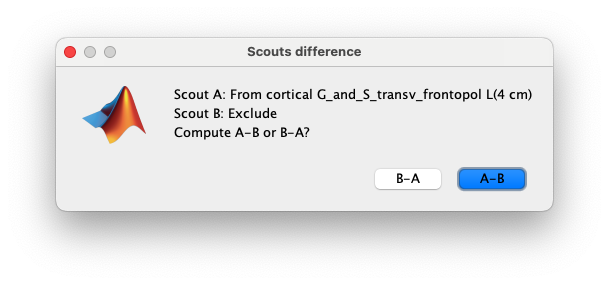
Use "ROI G_and_S_transv_frontopol L (custom)" - "exclude" which in this case is A – B.
We can now see the new search region, not including vertex near the previous montage:
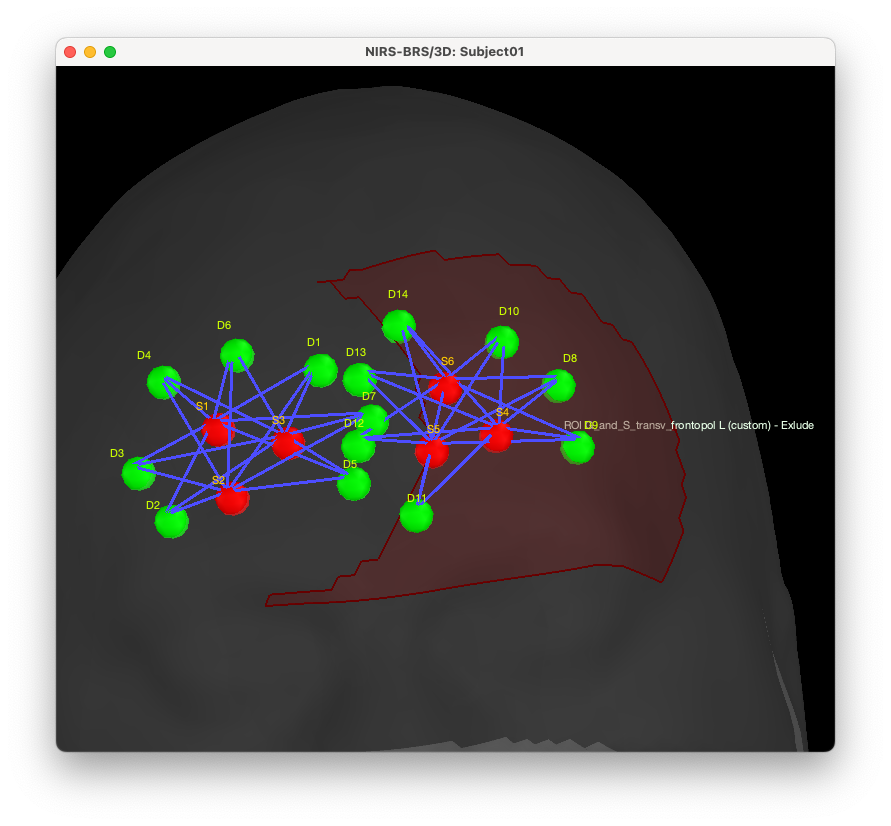
We can now re-estimate the optimal montage using this new search space. To do so, uncheck “Use default search space” and select “ROI G_and_S_transv_frontopol L (custom) - exclude” for the search space. Also, we recommend you to update the name to the output condition.

We will then obtain the following montages and light sensitivity maps. The 2nd line shows the average sensitivity within the left and right ROI. We observe that the light sensitivity in this case is higher for the right ROI (-0.6 dB) in comparison to the left ROI (-0.9 dB).
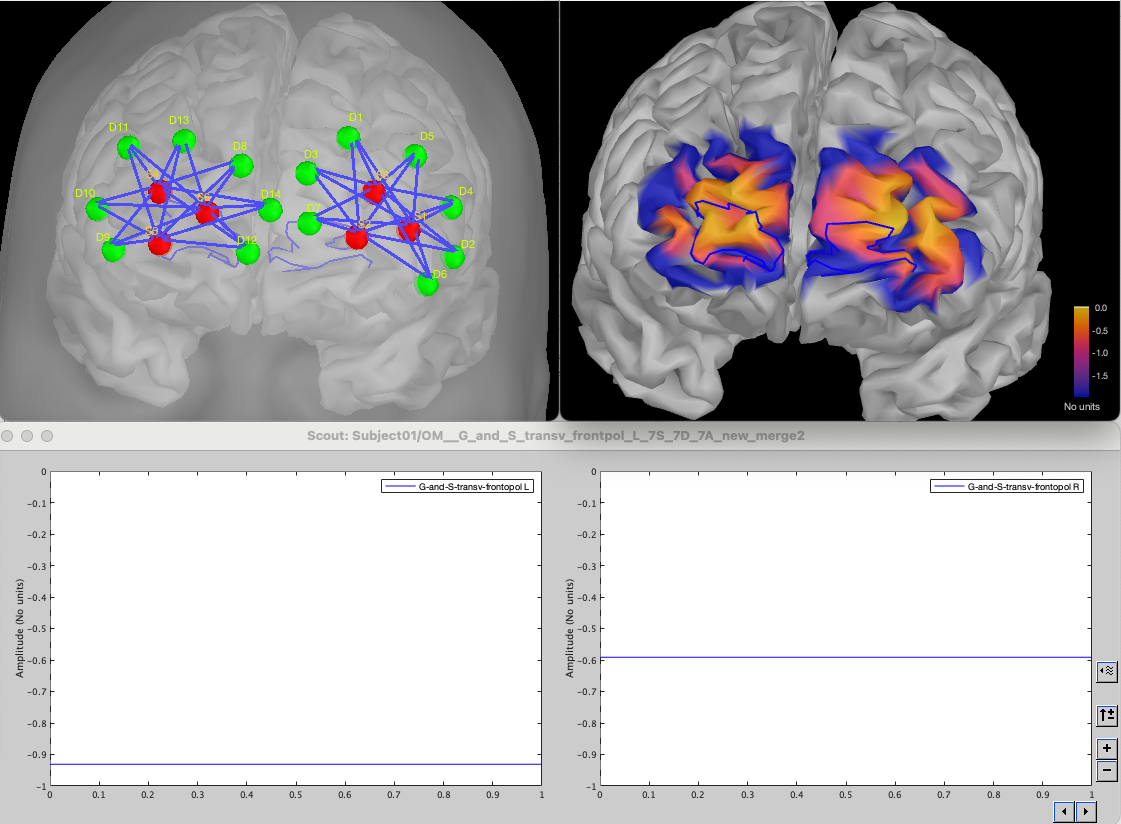
Note that we are creating here a small asymmetry between left and right ROI as the right ROI was able to use the entire search space when the left ROI will be constrained to not overlap with the montage for the right ROI, leading to a slightly sub-optimal montage causing the difference in light sensitivity.
Creating an optimal montage for EEG-FNIRS
Loading EEG position
In your Brainstorm database, create a new folder called EEG. You can then import the position from your EEG device by doing : right click on the folder > Use Default EEG cap > Colin27 > select the appropriate cap.
In our case, we will be using the cap “BrainProducts EasyCap 64”.
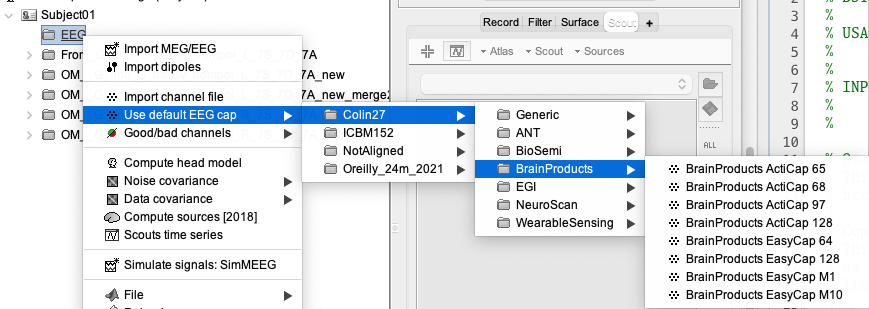
We can visualize the cap:
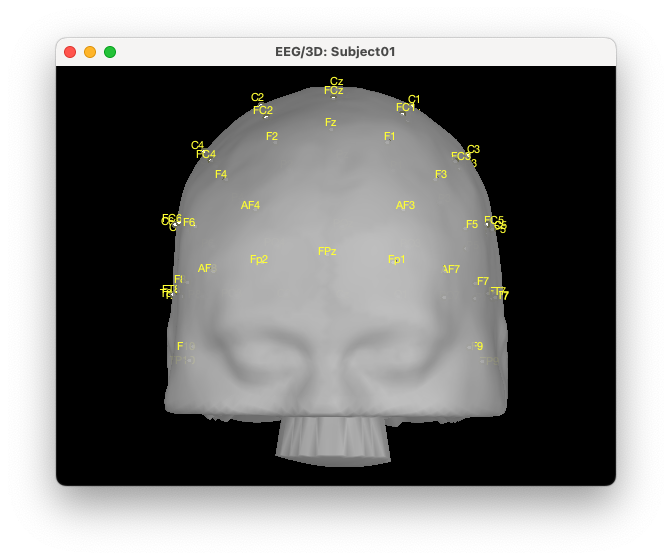
The first step to improve visualization is to project the electrodes on the scalp. To do so, right click on the EEG channels, then MRI registration, then EDIT. Then from the GUI use “Project electrodes on surface” (6th button from the right). Now, click on OK at the end of the row and save the modifications.
The cap now looks like this:
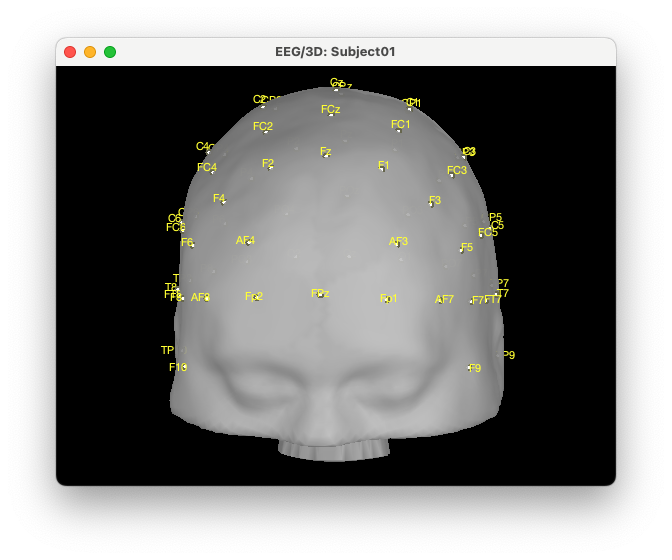
We then need to convert the position of the electrodes to scout on the head mesh. For that, right-click on the EEG montage > MRI Registration > Scalp scout from scalp sensors. And enter the radius around each electrode used to create the scout. In this case, we want to create an exclusion zone of 1 cm around each electrode, so we will enter 10 mm. Note that this would need to be adapted depending on the size of your EEG electrodes, NIRS optodes, and installation technique, as you want to find a good tradeoff between having a good co-localization of the EEG and fNIRS (lower radius) and making the installation feasible (larger radius).
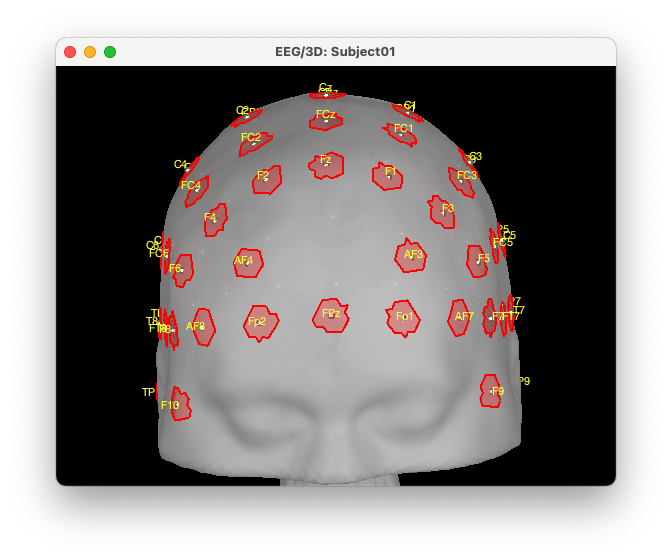
Reload protocol by making a right click on the protocol and choosing “reload” down at the bottom. A scout has been created on the scalp surface called “EEG | EEG NIRS (10 mm)”. Rename that scout to “ExcludeEEG” located in “Scout from sensors”. All the red regions correspond to the vertex we want to exclude from the search space for the NIRS optimal montage. Click on the new scout, open the Scout menu and click on copy. Then, go back to User scouts, open the Scout menu and click on paste.
Modifying the search space
We can overlay this exclusion zone with our previous search space for the right region: “From cortical G_and_S_transv_frontopol R(4 cm)”.

To modify the search space, we can take the difference between A: From cortical G_and_S_transv_frontopol R(4 cm). and B: ExcludeEEG by doing A – B.
We will then use the new created scout “From cortical G_and_S_transv_frontopol R(4 cm) - ExcludeEEG” as search space:
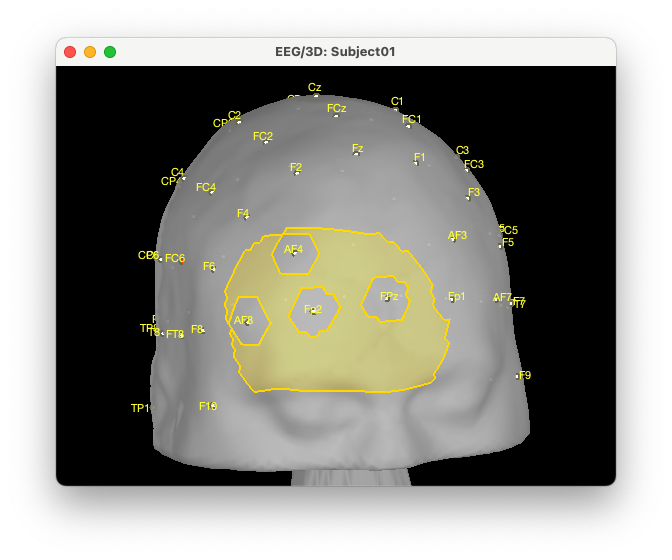
We can see that we effectively removed the EEG positions from the NIRS search space.
Computing the optimal montage
We can now recompute the NIRS montage. To use the custom search space, uncheck “Use default search space” and select “From cortical G_and_S_transv_frontopol R(4 cm) - ExcludeEEG”. Also, give a new name to the output condition.

We can see that the new montage is avoiding the EEG electrodes while still keeping a similar sensitivity pattern:
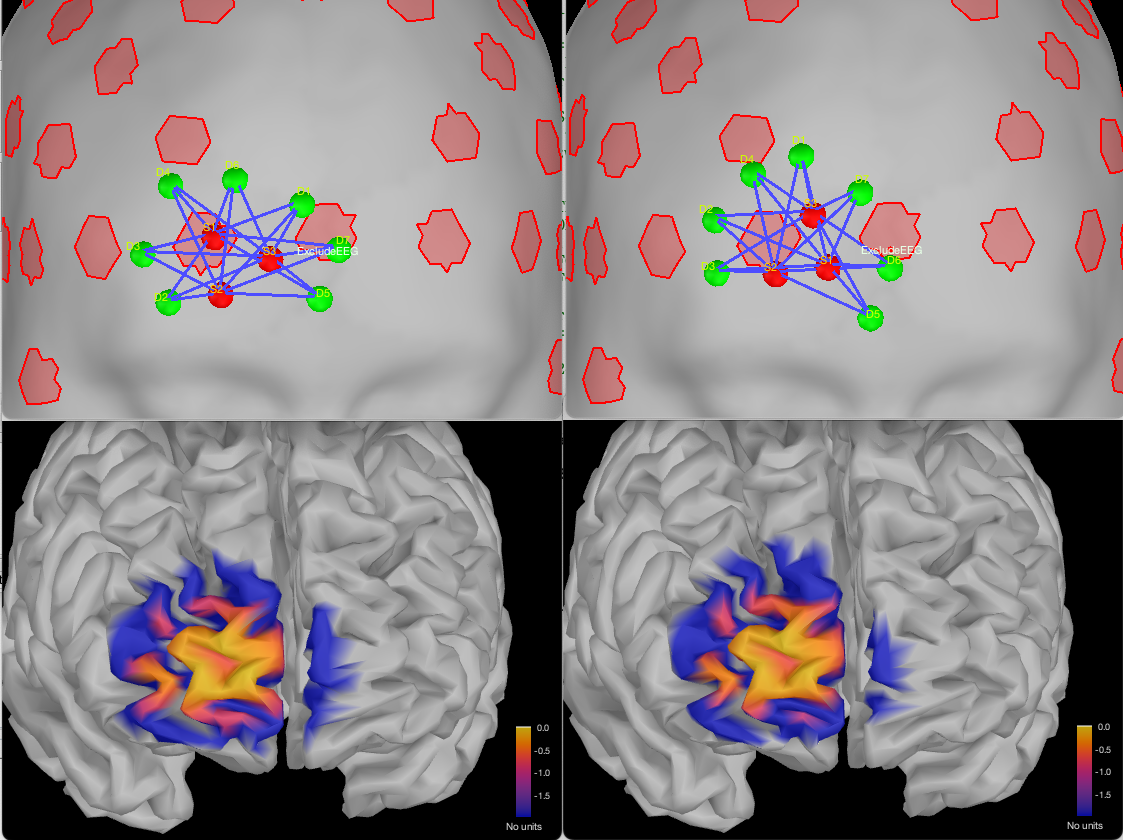
Note that since each map is normalized by its maximum value, we cannot directly compare the exact value between the two sensitivity maps. To do that comparison, re-export the sensitivity map using a linear scale :
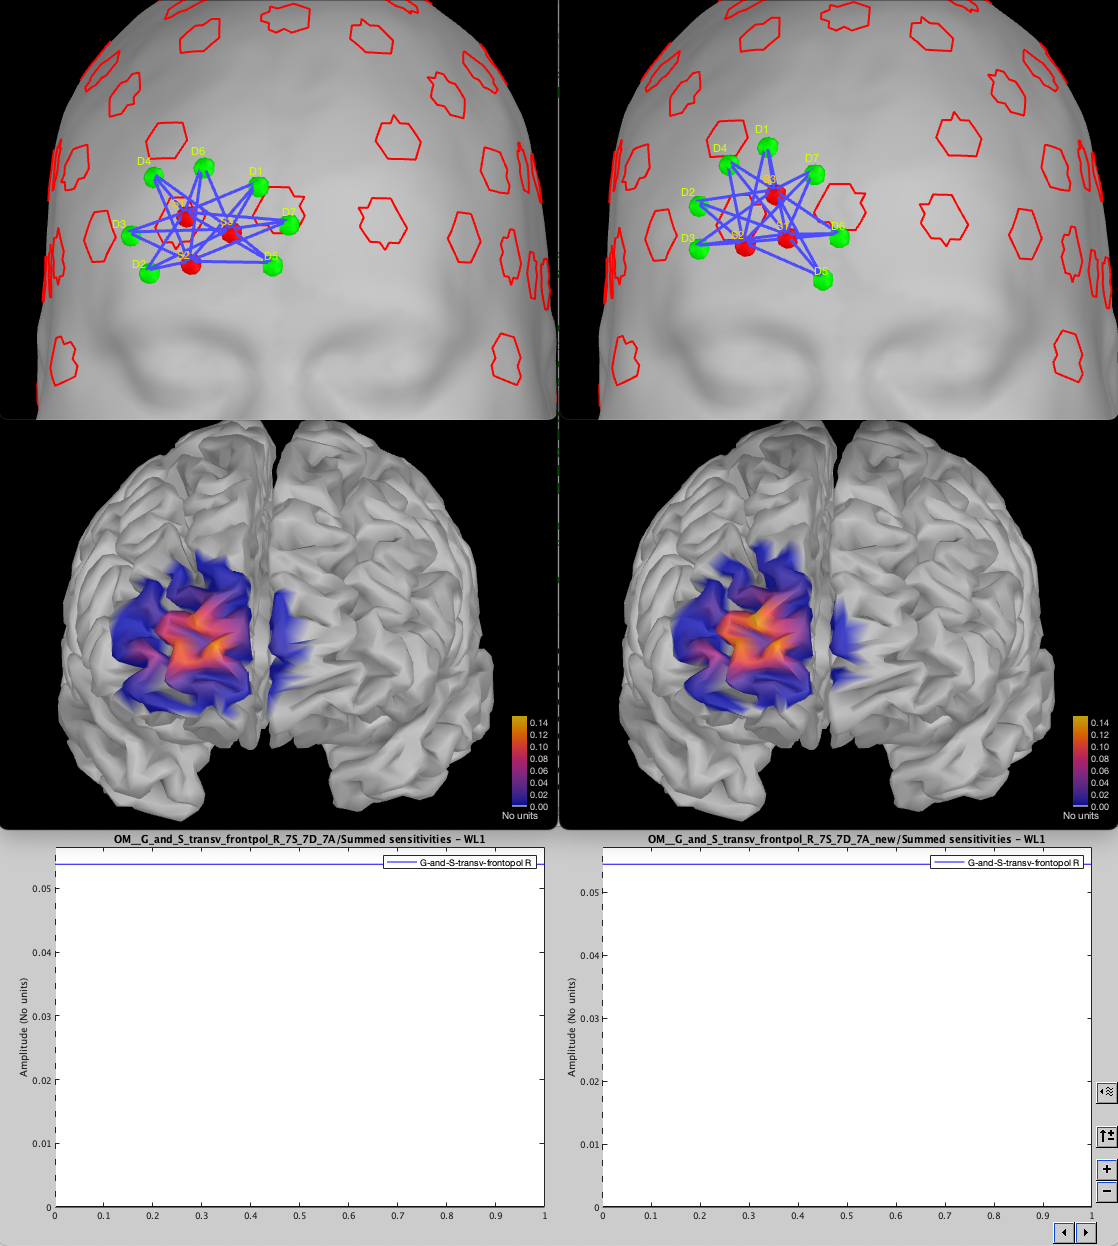
We can see that, in this case, removing the EEG from the search space did not impact the capacity of the optimal montage to find a montage targeting the ROI.
We can investigate the difference in sensitivity by examining the difference between the two sensitivity maps (old – new)
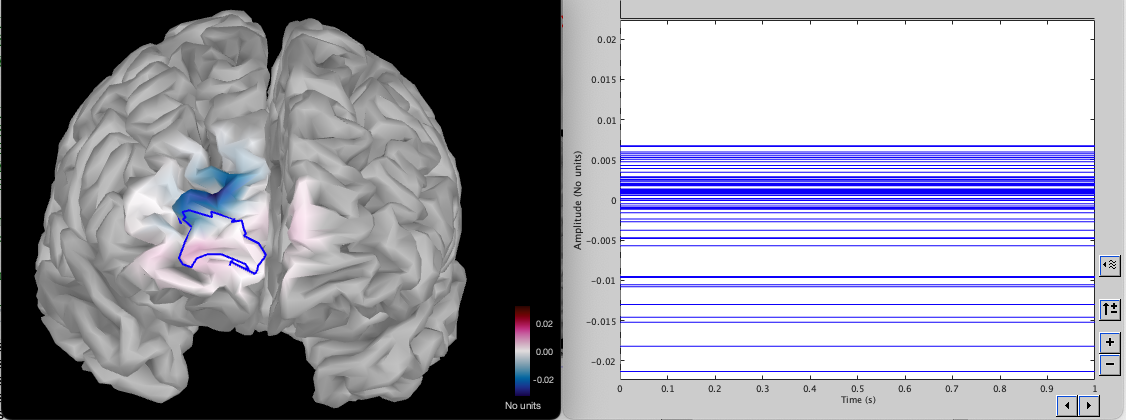
The map shows values where the new montage has a higher sensitivity in blue and in red where the previous montage had a higher sensitivity. We can see that the new montage has a slightly higher sensitivity outside the ROI but is similar inside the ROI. The right plot shows the difference in sensitivity for each vertex inside the ROI. Some vertices have higher sensitivity before (value larger than 0), and some have a higher sensitivity in the new montage (value less than 0).
Creating an optimal montage for using a fNIRS cap
In this section, we are going to use a cap with pre-defined positions on the head for the possible location for the fNIRS optodes. The main difference with the previous section is that we are going to constrain the search space to only consider those pre-defined locations.
In this section, we are going to target the right supramarginal gyrus (supramarginal R in the Desikan-Killianly atlas)
Loading the cap
In your Brainstorm database, create a new folder called "cap".
You can then import the position from your cap by right clicking on the folder and use ‘ Use Default EEG cap, then Colin27, then select the appropriate cap’.
You can then import the position from your cap: right click on the folder > Use Default EEG cap > Colin27 > select the appropriate cap.
In our case, we will be using the cap “BrainProducts ActiCap 128”.
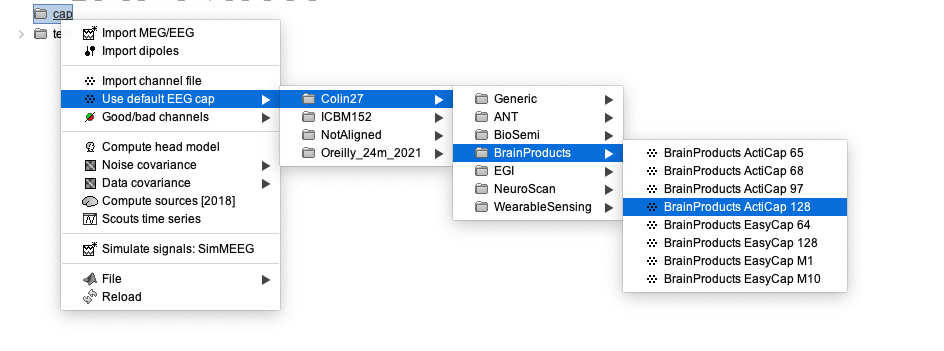
The first step to improve visualization is to project the electrodes on the scalp. To do so, right click on the EEG channels, then MRI registration, then EDIT. Then from the GUI use “Project electrodes on surface” (6th button from the right). Now, click on OK at the end of the row and save the modifications.
The cap looks like this:
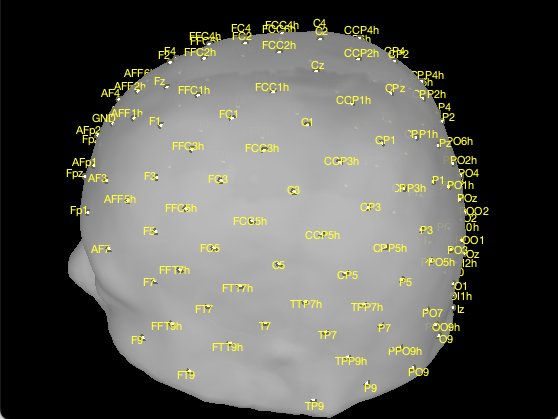
We now need to convert each sensor into a position on the scalp that we will use as search space for the optimal montage.
For that, right-click on the montage > MRI Registration > Scalp scout from scalp sensors. Enter the radius around each electrode used to create the scout. In this case, we want to use the closest vertex on the skin to be used in the search space, so we will enter 0 mm for the radius.
Reload protocol by making a right click on the protocol and choosing “reload” down at the bottom. If we open the head mesh, we can see that a new scout has been created called “EEG | EEG NIRS (0 mm)”. Rename that scout to “cap_nirs” located in “Scout from sensors”. All the red regions correspond to the vertex we want to exclude from the search space for the NIRS optimal montage.
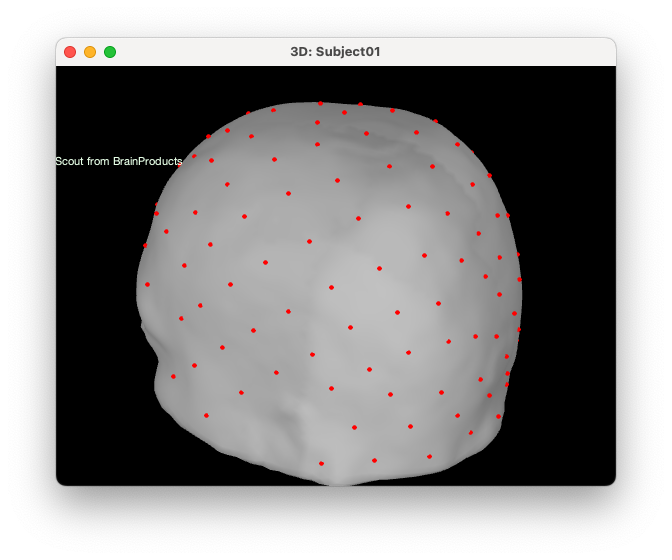
Computing the optimal montage

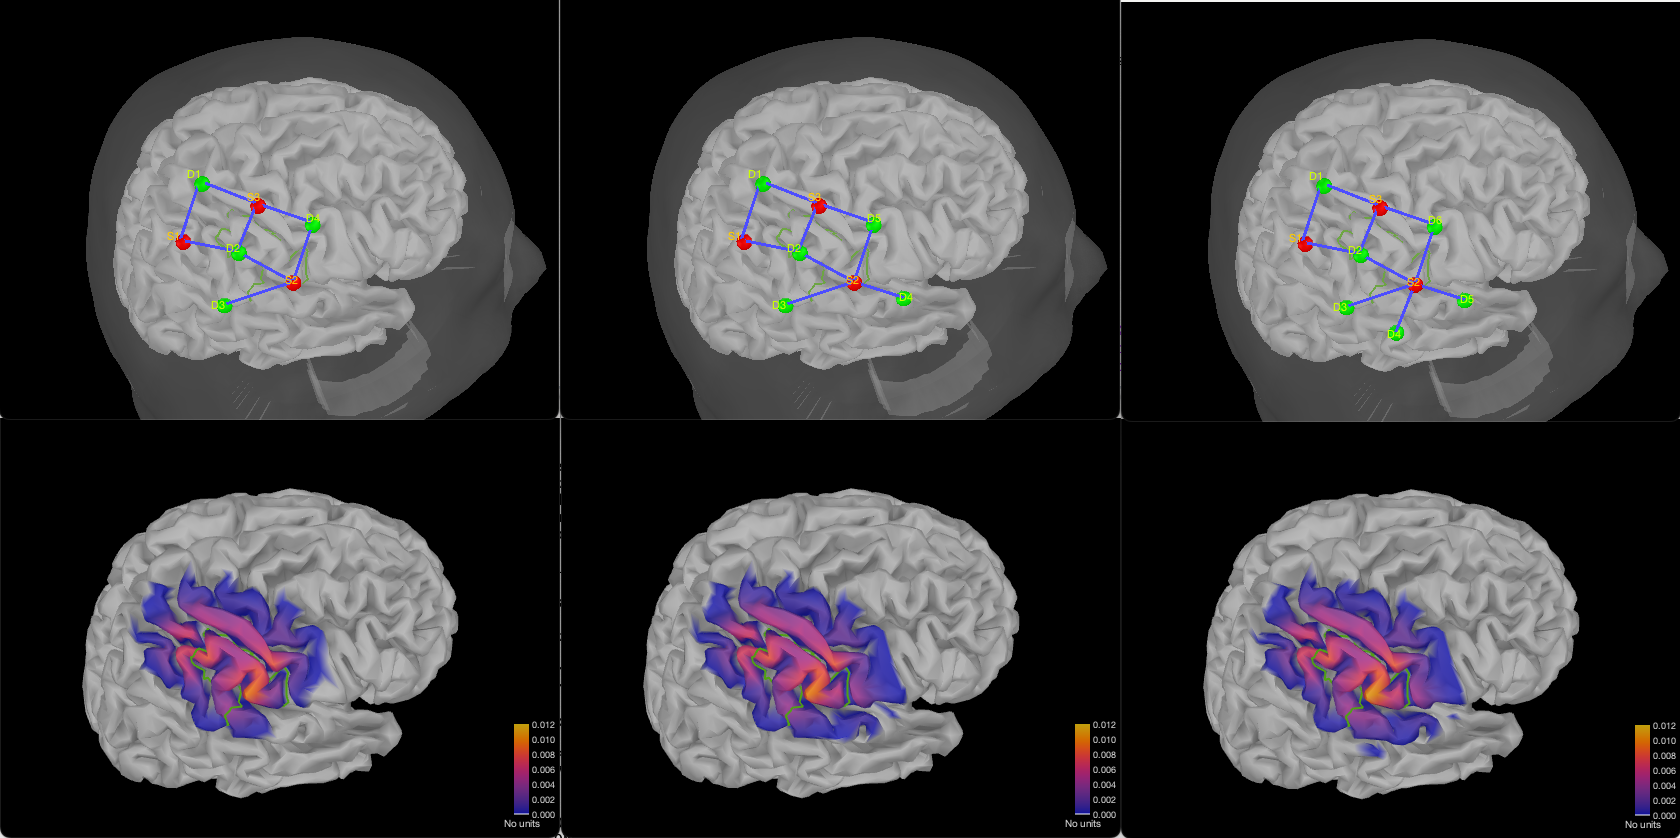
Finding good parameters for the number of source/detectors and adjacency can be more difficult on a cap than with a regular optimal montage. However, the weight table is independent of those parameters. It is therefore easy and fast to test multiple configurations so one can then decide on the optimal montage.
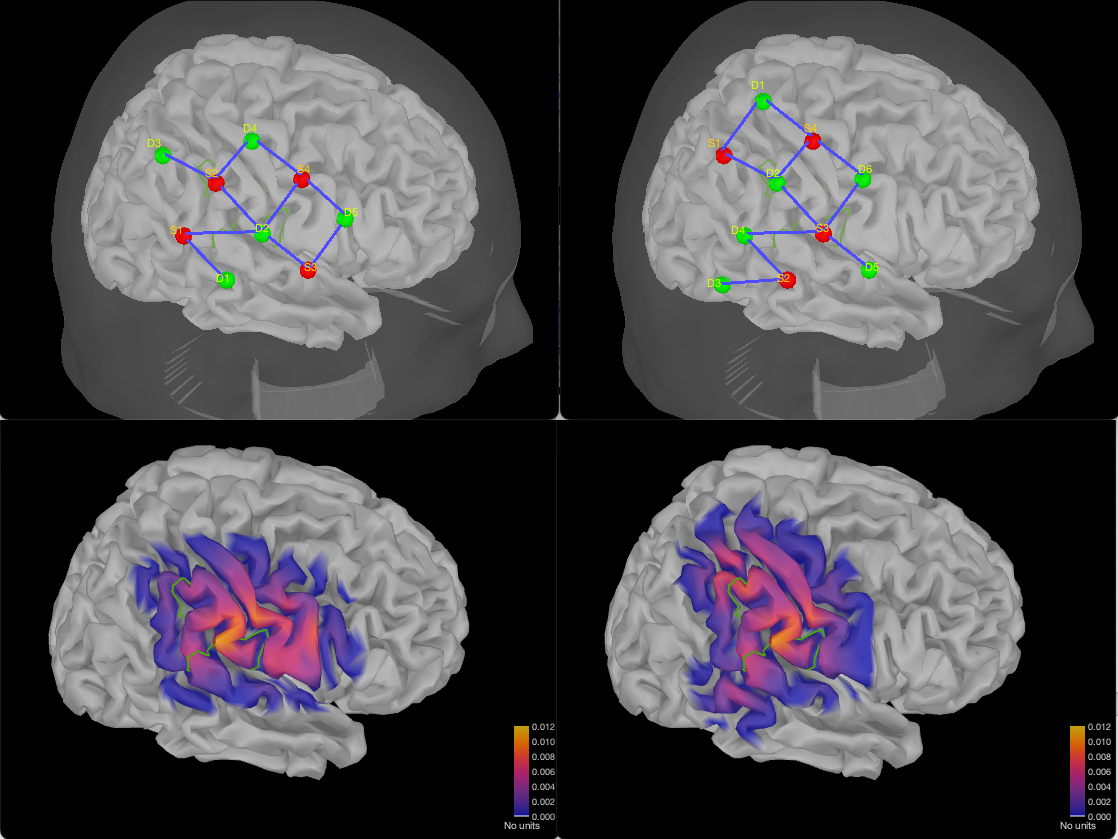
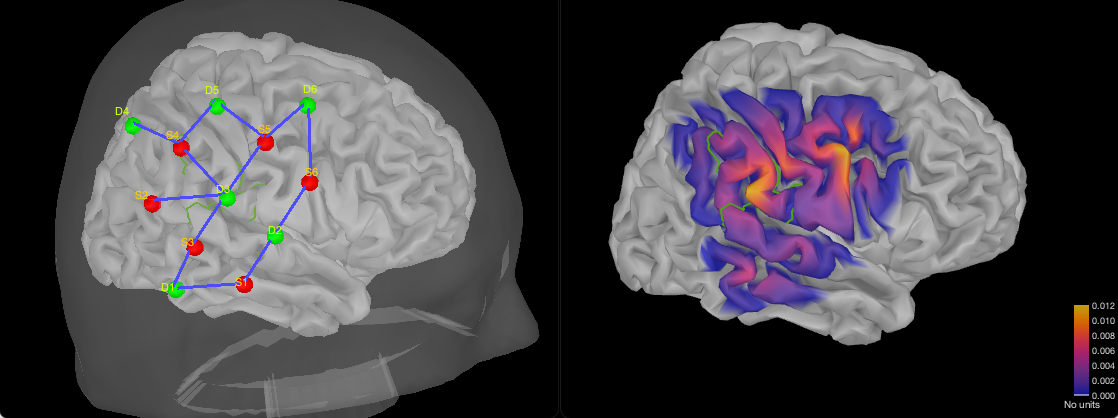
Here is an example of multiple montages for 3 sources, and either 4, 5, or 6 detectors and 3 adjacency. Each figure shows the montage along with the summed sensitivity map on a linear scale. It is important to select linear for the scale when exporting the sensitivity map to be able to compare the sensitivity between montages. (Note that the colorbar is also the same in every figure)
Here are two configurations using 4 sources, and respectively 5 or 6 detectors.
Finally, here is a montage with 6 sources and 6 detectors:
Personalized optimal montage
In this section, we are going to investigate how to compute all the elements of the optimal montage from scratch by recreating the montage used in the main NIRSTORM tutorial ( https://neuroimage.usc.edu/brainstorm/Tutorials/NIRSTORM) targeting the "hand knob" in the motor cortex. This section is useful if you wish to – compute a montage specific for each individual participating in your study, or if you want to use another template than Colin27 to model your target population (useful if you are targeting infants).
The main steps required to prepare the estimation of the optimal montage are the following:
- Importing the subject anatomy
- Estimating / Importing the subject tissue segmentation
- Estimating the Volume to cortex interpolation function (also known as Voronoi)
- Estimating the fluences for every vertex in the search space using MCXlab
For this section, download the dataset from: https://osf.io/md54y/?view_only=0d8ad17d1e1449b5ad36864eeb3424ed .
More information about the data can be found here: https://neuroimage.usc.edu/brainstorm/Tutorials/NIRSTORM
Importing the subject anatomy
The first step when computing the optimal montage is to import the segmented anatomy of the subject. This can be obtained through various software such as Cat12 or Freesurfer. For more information about the supported software in Brainstorm, consult the MRI segmentation tutorial: https://neuroimage.usc.edu/brainstorm/Tutorials#Advanced_tutorials
The main information required are:
- The subject MRI
- The head mask: Mesh representing the scalp surface.
- The cortical surface: Mesh representing the cortical surface. Ideally, we want to use the central (or mid) surfaces. The central surfaces are meshes halfway between the grey-white interface and the external pial surface (grey-CSF interface).
In this tutorial, the MRI was segmented using FreeSurfer.
- Start by creating a new subject.
- Switch to the "anatomy" view of the protocol.
Right-click on the subject node > Import anatomy folder:
- Set the file format: "Freesurfer + volumes atlases"
Select the folder: nirstorm_tutorial_2024/derivatives/FreeSurfer/sub-01
- Number of vertices of the cortex surface: 15000 (default value)
- Answer "yes" when asked to apply the transformation.
Set the 3 required fiducial points, indicated below in (x,y,z) MRI coordinates. You can right-click on the MRI viewer > Edit fiducial positions > MRI coordinates, and copy-paste the following coordinates in the corresponding fields. Click [Save] when done.
        Nas   :    [ 131, 213, 117 ]
        Lpa   :    [  51, 116,  80 ]
        Rpa   :    [ 208, 117,  86 ]
        Ac    :    [ 131, 128, 130 ]
Pc : [ 129, 103, 124 ]- Once the anatomy is imported, make sure that the surface "mid_15002V" is selected (green). If it is not, right-click on it and select "set as default cortex". This will define the cortical surface on which fNIRS 3D reconstructions will be estimated.
- Resample the head mask to get a uniform mesh on the head. For that, right-click on the head mask and select remesh, then 10242 vertices. This allows us to get a uniform mesh on the head. This step is important as it will define the position used for the search space and we want the position inside the search space to be distributed in a uniform manner along the skin surface.
Your database should look like this:
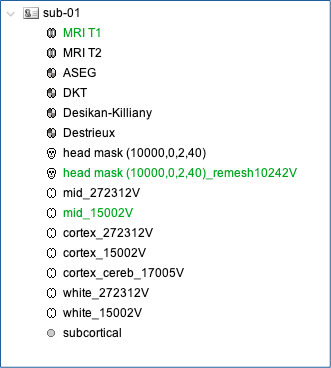
Note that the elements that appear in green correspond to those used for later computations. It is important that the new head mask (remeshed) and the mid-surface (mid_15002V) are selected and appear green in your database.
Additionally, we defined the hand-knob on the mid-surface. Open the mid surface, and use Atlas > Add scouts to Atlas and select the FreeSurfer annotation: nirstorm_tutorial_2024/derivatives/segmentation/sub-01/scout_hand.annot
Definition of FluenceRegion and FluenceExclude
In NIRSTORM, two scouts defined on the head surface play a particular role when computing fluences: FluenceRegion and FluenceExclude. FluenceRegion and FluenceExclude are two scouts containing information about the possible optodes locations on the head. FluenceRegion indicates all the positions for which we can place optodes and for which we pre-computed the fluences. FluenceExclude contains all the regions for which it is impossible to put optodes (Region near the eye or the ear). FluenceExclude is used internally to avoid the montage overlap with the eyes or ears of the subject. To define them, open the skin mesh and define two new scouts "FluenceRegion" and "FluenceExclude".
For FluenceRegion, add a first vertex at the approximate position where Cz would be (midpoint between the two ears) then expand the scout until it covers most of the head.
For FluenceExclude, start a new scout at the center of each region you will want to exclude (e.g. One region per eye, and one region per ear). If you see any artifact from the segmentation on the head, include them too in FluenceExclude. You can then merge all the subregions and rename the scout FluenceExclude. For this particular subject, we want the region to look like the following image: (FluenceRegion is in green, and FluenceExclude is in red).

Estimating the subject tissue segmentation
To estimate the propagation of infrared light inside the head, we need to compute a volumetric segmentation of the head into 5 tissue segmentation (skin, CSF, grey matter, white matter). This can be done using SPM or Cat12.
SPM12 can also be used to segment the MRI into 5 tissues: Right-click on the T1 MRI and use MRI segmentation > SPM12. If you have a T2 image, Brainstorm will ask you if you want to use the T2 to refine the MRI segmentation: Answer “yes”. The output is a tissue segmentation called “tissues_segment”.
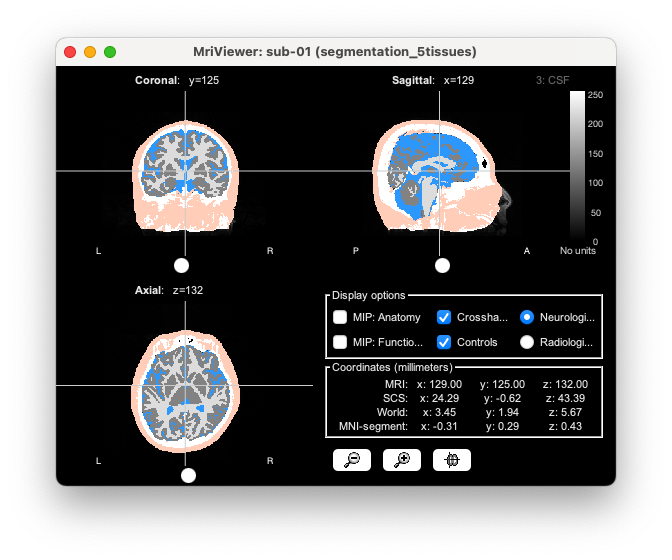
- Rename the segmentation to “segmentation_5tissues”. The name is important for the following processes.
For the tutorial, we are going to import a pre-computed segmentation of the MRI using a combination of SPM12 and FreeSurfer.
For this tutorial, we are providing a pre-computed 5 tissue segmentation. To import this pre-computed segmentation,
Right-click on the subject node > Import MRI
- Set the file format: Volume atlas (subject space)
- Select the file nirstorm_tutorial_2024/derivatives/segmentation/sub-01/segmentation_5tissues.nii using Volume atlas (subject space) for the file format
- Answer “Ignore” to the question “How to register the new volume with the reference image” (The segmentation is already co-registered with the reference image)
- Answer “no” to the question “Reslice Volume”. We do not need to reslice the segmentation.
You can then visualize the segmentation on top of the subject MRI:
Estimating the Voronoi volume-to-cortex interpolator
Voronoi interpolator is a function that allows us to project any volume to the cortical surface. Such projection is achieved using a Voronoi projection: each voxel is associated with a Voronoi cell describing the interpolation kernel for a specific vertex of the cortical surface, resulting in an anatomically informed interpolation scheme based on Voronoi diagrams [7]. The resulting volume-to-surface interpolation scheme is therefore informed by the underlying anatomical sulco-gyral geometry (See Grova et al. 2006 [7] for more information).
To compute the Voronoi interpolator:
- click on run, without any file in the process box
Under NIRS > Sources, select Compute Voronoi volume-to-cortex interpolator. Then select the subject and use the Grey matter masking option.
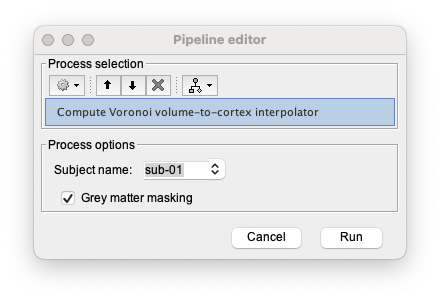
If you did not estimate the segmentation or forgot to rename it “segmentation_5tissues”, the following warning will appear. Delete the estimated Voronoi interpolator (“Voronoi interpolator for MRI T1 onto mid_15002V”), ensure you imported and named properly the segmentation, and then run again the Voronoi estimation.

Projecting a volume onto the cortical surface
As explained before, a Voronoi interpolator can be used to project any volume on the cortical surface. In our case, we mainly use it to project the fluence on the cortex, but it can be used to project any volume of interest to the cortex. One classic example would be to project fMRI statistical map on the cortex.
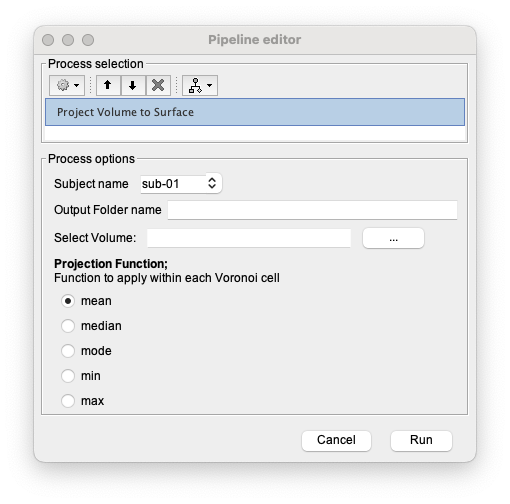
To project a volume on the cortex using the Voronoi interpolator, select NIRS > Sources > Project Volume to Surface. Then select the subject name, enter a name for the folder in which the volume will be saved in your Brainstorm database, select the volume to project on the cortical surface, and finally select the function to apply on each Voronoi cell. This function will be applied to each Voronoi cell to obtain the value for the associated vertex on the cortex.
Note: The volume needs to be co-registered with the imported T1 in your Brainstorm database. The two volumes also need to have the same dimensions.
Estimating the fluences for every vertex in the search space using MCXlab
We then need to estimate the fluences for every vertex in the search space defined here as all the vertex with a 4 cm radius around the hand knob. For that, we will be using the plugin MCXlab integrated in Brainstorm. If your computer has a GPU supporting CUDA, load "mxclab-cuda", otherwise, load the plugin "mcxlab-cl".
For performance reasons, we recommend using mcxlab-cuda along with a good GPU as this step is computationally intensive. Consult http://mcx.space/gpubench/ for a benchmark of different GPUs.
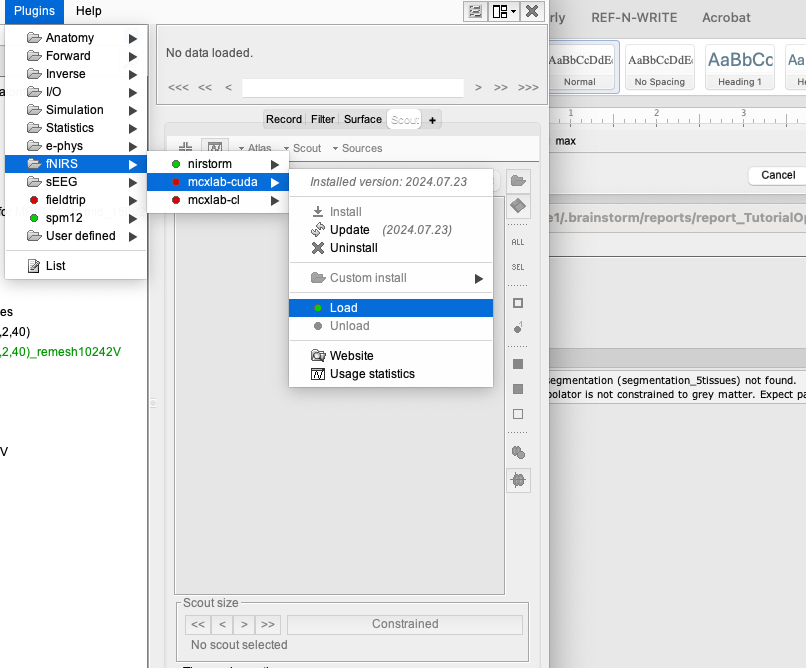
Then use NIRS > Sources > compute fluence. Select the subject name, and click on Edit.
The following panel will appear:
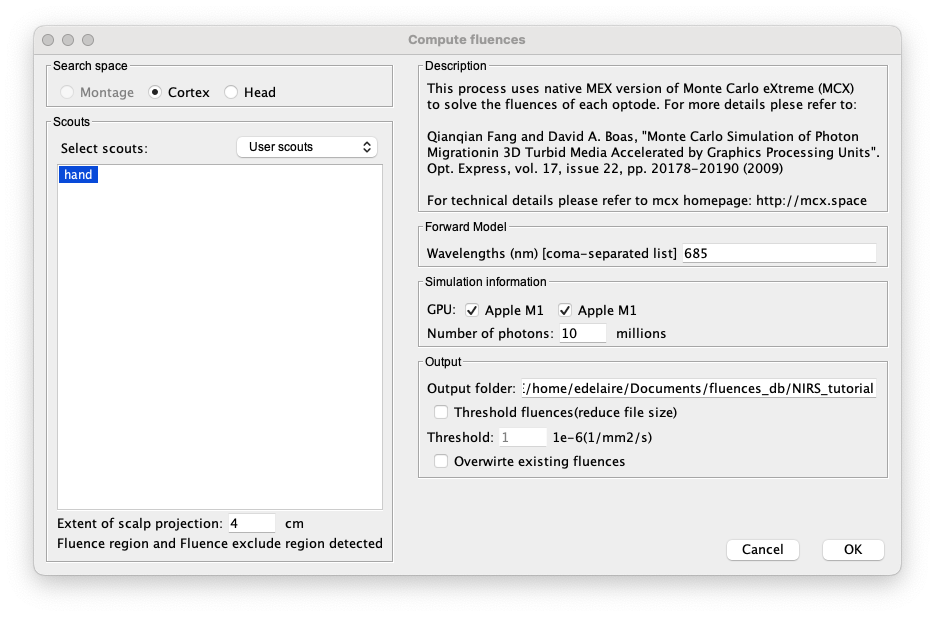
In that panel, you need to:
- Select the target ROI on the cortex. Here "hand".
Specify the extent of the scalp projection (radius to get the search space on the skin). Here we will keep 4cm. If you defined “FluenceRegion” and “FluenceExclude” on the head mesh, then a message will indicate that they are detected and will be used.
- Specify the wavelength used for the optimal montage. Keep 685 nm
- Specify the GPU used by checking the correct boxes.
- Specify the number of photons used for each vertex. Since this is computationally intensive, we recommend using 10 or 20 million photons.
- Then, specify a folder to store the fluences. This folder will be used when estimating the optimal montage.
Note: This process can take several hours, even using a good GPU.
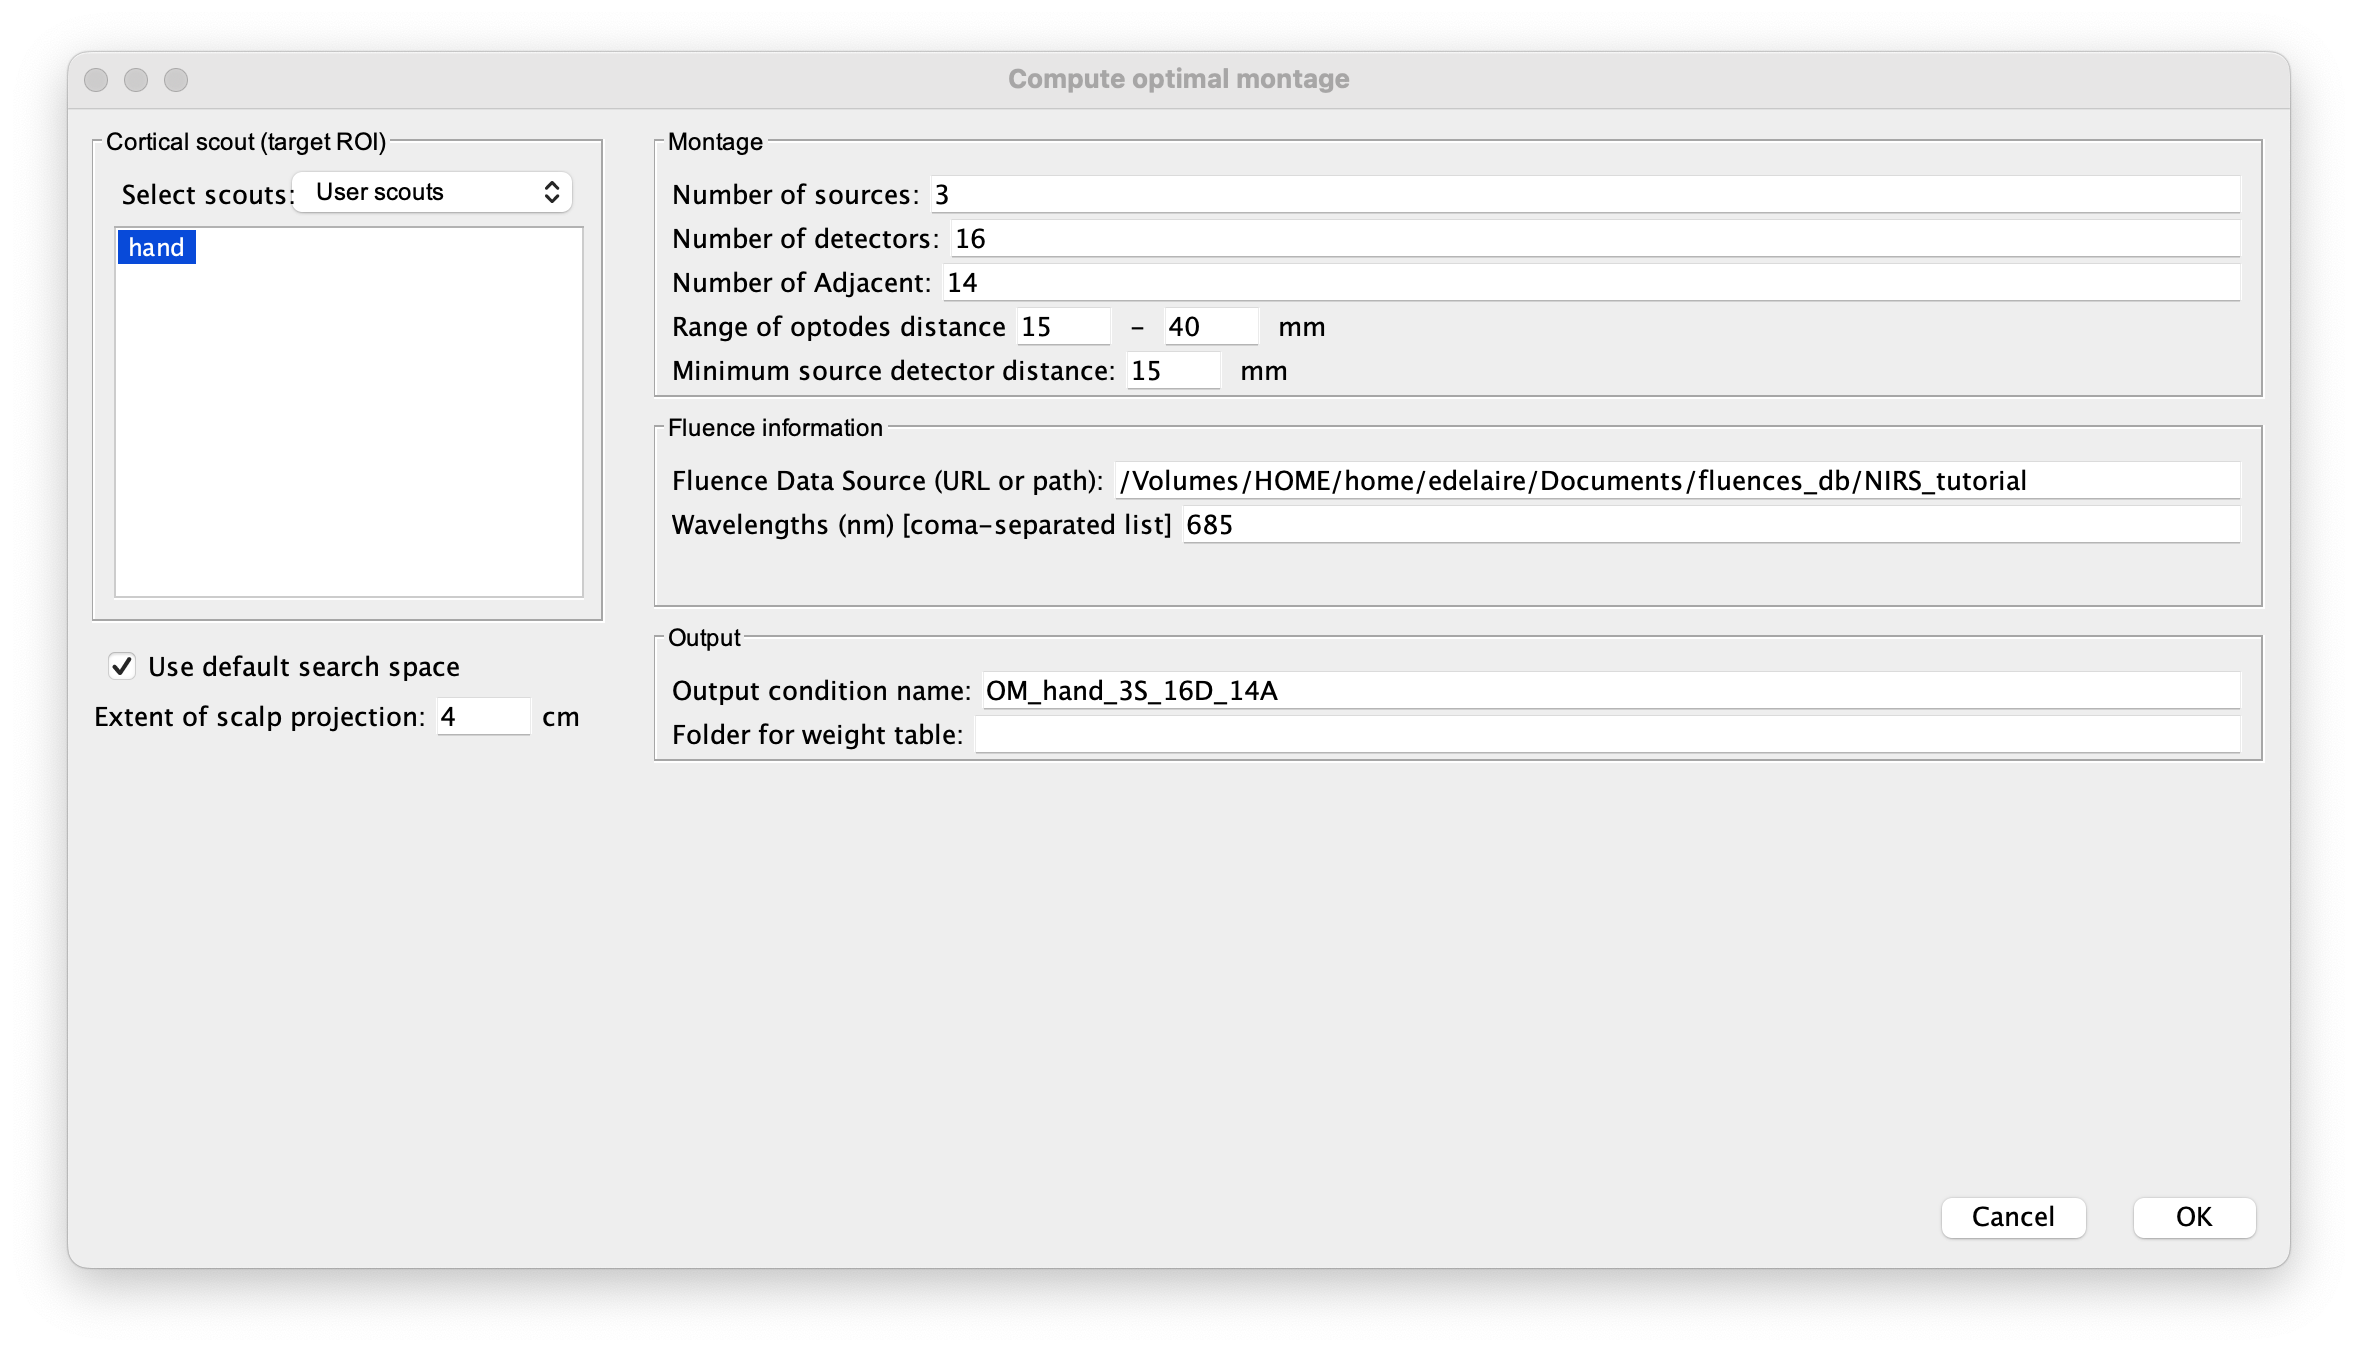
Computing the optimal montage
Finally, you can then estimate the optimal montage as explained in the previous section.
- Ensure that you are using the same extent for the scalp projection as for the fluence
- Ensure that the fluence data source corresponds to the folder specified during the fluence estimation
- Ensure that the wavelength is the same as during the fluence estimation.
Warning message: Denoise of the sensitivity matrix to remove outliers
Using the tutorial dataset, you will never see this warning message. However, you might get this message when running the optimal montage on subject specific anatomy in the report viewer:

In case of outliers in the sensitivity matrix and thus in the fluences, NIRSTORM is applying a filter to remove them. However, this only creates a temporary version of the modified fluences and does not modify them in the folder containing the fluences.
That is why, if you see this message, you need to recompute the fluences of this specific montage before moving to the next part:
Drag and drop the separation file into the process box and click on the RUN button at the bottom left of Brainstorm. In the pipeline editor, click on the gear icon in the top left corner, and then select the process NIRS > Sources > compute fluences;
- Select the right subject name, then click on edit. You will see this panel:

- Check that the Montage option is selected
- Set the number of photons to a higher value (100 to 200 millions for example)
- Add the output folder. Here are two options:
- Add the path to all the fluences used to compute the optimal montage. If so, tick the box Overwrite existing fluences
- Add a different path leading to an empty folder
Using coverage constraint
Some ROIs can be too wide to use only the regular optimal montage script. By using a coverage constraint, this will force the montage to extend in order to cover as much of the ROI surface as possible.
Warning : When trying to cover your own region, always remember to test different values of sources, detectors, adjacency and extent of scalp projection value. Creating an optimal montage is always a tradeoff between all these parameters. In the example, if you do not take enough sources or detectors, the montage will not spread over the whole region of interest even with coverage constraints because of the overlap constraint.
This new feature was inspired by the article called "Array Designer: automated optimized array design for functional near-infrared spectroscopy" written by Brigadoi and al. (https://doi.org/10.1117/1.NPh.5.3.035010).
Creation an ROI based on multiple ROIs of an atlas
Let’s create an ROI covering an entire hemisphere of the brain. To do that, import the subject Colin27, open the head model and click on the add surface button (in the Surface tab, over surface options, on the right side) and select cortex. Then, go to the Scout tab, change the scout to MarsAtlas, click the “SEL” button on the right side of Brainstorm. Now select the 6 following scouts (to select multiple scouts simultaneously, maintain the ctrl key pressed) : L_IPCd, L_SPC, L_Sdl, L_Mdl, L_PMdl, L_PFcdl. With all these regions selected, the head model should look like this :

Now, open the scout menu and click on copy. You can then go to User scouts, open the scout menu and click on paste :

Once all the scouts are in User scouts, select them all, open the scout menu and click on Merge. You will obtain this ROI. Here, we chose to rename it “ROI” but the name is not important.

Once the ROI is merged, you can launch the optimal montage process. However, here, due to the size of the ROI, we will need the coverage constraint to make sure the montage tends to cover the whole ROI. To do so, click on the RUN button (bottom left of Brainstorm). In the pipeline editor, click on the gear icon in the top left corner, and then select the process NIRS > Sources > Compute optimal montage > Edit…
Now, in the optimal montage panel, check the coverage box. A new line will appear asking you to set values of lambda.

If you check the coverage button, the algorithm will try to find a balance between maximizing the sum sensitivity to the ROI and the coverage. This balance is controlled by the parameter called lambda where lambda = 0, will only consider the sensitivity and high lambda will only consider the coverage.
Interesting lambda values to look at are located between 0 and 10. That is why, in this example we will set min value to 0, step value to 1 and max to 10. We also set 8 sources, 8 detectors, 3 adjacencies and scalp projection value at 4 cm.
Nb : Because each montage takes 5 minutes to be computed, it will take NIRSTORM around 1 hour to complete this task, since we have to run the optimal montage once per value of lambda.
Once it has finished, you should have files organized like this :

As you can see, the first 11 lines are the montages with all values of lambda (between 0 and 10). You also have the “simple” montage which corresponds to the montage without coverage constraint and without normalization of the sensitivity matrix. Overall, you will have montage that do not cover the whole region but, in this case, montage 8 does cover the whole region :

Of course, due to the variability of the optimization, it is likely that you will not get the same montage. The only thing important is for you to get a montage covering the whole ROI.
Reference
- Fang Q, Boas DA. Monte Carlo Simulation of Photon Migration in 3D Turbid Media Accelerated by Graphics Processing Units. Opt Express. 2009;17(22):20178. doi:10.1364/oe.17.020178
- Land AH, Doig AG. An Automatic Method of Solving Discrete Programming Problems. Econometrica. 1960;28(3). doi:10.2307/1910129
- Delaire É, Vincent T, Cai Z, et al. NIRSTORM: a Brainstorm extension dedicated to functional Near Infrared Spectroscopy (fNIRS) data analysis, advanced 3D reconstructions, and optimal probe design. bioRxiv. Published online 2024. doi:10.1101/2024.09.05.611463
- Machado A, Marcotte O, Lina JM, Kobayashi E, Grova C. Optimal optode montage on electroencephalography/functional near-infrared spectroscopy caps dedicated to study epileptic discharges. J Biomed Opt. 2014;19(2):026010. doi:10.1117/1.jbo.19.2.026010
- Machado A, Cai Z, Pellegrino G, et al. Optimal positioning of optodes on the scalp for personalized functional near-infrared spectroscopy investigations. J Neurosci Methods. 2018;309:91-108. doi:10.1016/j.jneumeth.2018.08.006
- Cai Z, Uji M, Aydin Ü, et al. Evaluation of a personalized functional near infra-red optical tomography workflow using maximum entropy on the mean. Hum Brain Mapp. 2021;42(15):4823-4843. doi:10.1002/hbm.25566
- Grova C, Makni S, Flandin G, Ciuciu P, Gotman J, Poline JB. Anatomically informed interpolation of fMRI data on the cortical surface. Neuroimage. 2006;31(4):1475-1486. doi:10.1016/j.neuroimage.2006.02.049
- Brigadoi S, Salvagnin D, Fischetti M, Cooper RJ. Array Designer: automated optimized array design for functional near-infrared spectroscopy. Neurophotonics. 2018 Jul;5(3):035010. doi: 10.1117/1.NPh.5.3.035010.
