|
Size: 14510
Comment:
|
Size: 14939
Comment:
|
| Deletions are marked like this. | Additions are marked like this. |
| Line 1: | Line 1: |
| <<HTML(<style>.backtick {font-size: 16px;}</style>)>><<HTML(<style>abbr {font-weight: bold;}</style>)>> <<HTML(<style>em strong {font-weight: normal; font-style: normal; padding: 2px; border-radius: 5px; background-color: #EEE; color: #111;}</style>)>> | <<HTML(<style>.backtick {font-size: 16px;}</style>)>><<HTML(<style>abbr {font-weight: bold;}</style>)>> <<HTML(<style>em strong {font-weight: bold; font-style: normal; padding: 2px; border-radius: 5px; background-color: #DDD; color: #111;}</style>)>> |
| Line 4: | Line 4: |
| '''[TUTORIAL UNDER DEVELOPMENT: NOT READY FOR PUBLIC USE] ''' |
|
| Line 16: | Line 18: |
| The dataset is comprised of MEG (151-channel CTF MEG system) and bipolar EMG (from left and right extensor carpi radialis longus muscles) recordings from one subject during an experiment in which the subject had to lift her hand and exert a constant force against a lever. The force was monitored by strain gauges on the lever. The subject performed two blocks of 25 trials in which either the left or the right wrist was extended for about 10 seconds. Only data for the left wrist will be analyzed in this tutorial. | The dataset is comprised of MEG (151-channel CTF MEG system) and bipolar EMG (from left and right extensor carpi radialis longus muscles) recordings from one subject during an experiment in which the subject had to lift her hand and exert a constant force against a lever. The force was monitored by strain gauges on the lever. The subject performed two blocks of 25 trials in which either the left or the right wrist was extended for about 10 seconds. In addition to the MEG and EMG signals, EOG signal was recorded to assist the removal of ocular artifacts. Only data for the left wrist will be analyzed in this tutorial. |
| Line 39: | Line 41: |
| [[attachment:viewer_mni_norm.png]] {{attachment:viewer_mni_norm.png}} [[attachment:viewer_mni_norm.png|{{attachment:viewer_mni_norm.png|attachment:viewer_mni_norm.png}}]] [["Tutorials/CorticomuscularCoherence?action=AttachFile&do=get&target=viewer_mni_norm.png"|{{attachment:viewer_mni_norm.png|attachment:viewer_mni_norm.png}}]] https://neuroimage.usc.edu/brainstorm/Tutorials/CorticomuscularCoherence?action=AttachFile&do=get&target=viewer_mni_norm.png get IMAGE after_mni_norm |
{{{#!wiki comment {{attachment:viewer_mni_norm.png}} }}} . [[https://neuroimage.usc.edu/brainstorm/Tutorials/CorticomuscularCoherence?action=AttachFile&do=get&target=viewer_mni_norm.png|{{attachment:viewer_mni_norm.png|https://neuroimage.usc.edu/brainstorm/Tutorials/CorticomuscularCoherence?action=AttachFile&do=get&target=viewer_mni_norm.png}}]] |
| Line 57: | Line 58: |
| IMAGE result_tree | . {{attachment:import_result.png||width="40%"}} |
| Line 61: | Line 62: |
| IMAGE overlap cortex and innerskul | . {{attachment:over_innerskul_cortex.png||width="50%"}} |
| Line 64: | Line 65: |
| === Link the recordings === | |
| Line 71: | Line 73: |
| * The '''''Link to raw file''''' node is a '''link to the original file''' that you imported. All the relevant meta-data was read from the MEG dataset and copied inside the link itself (sampling rate, number of samples, event markers and other details about the acquisition session). As it is a link, no MEG recordings were copied to the database. When we open this file, the values are read directly from the original files in the .ds folder. [[Tutorials/ChannelFile#Review_vs_Import|More information]]. | * The '''''Link to raw file''''' node is a '''link to the original file''' that was selected. All the relevant meta-data was read from the MEG dataset and copied inside the link itself (sampling rate, number of samples, event markers and other details about the acquisition session). As it is a link, no MEG recordings were copied to the database. When we open this file, the values are read directly from the original files in the .ds folder. [[Tutorials/ChannelFile#Review_vs_Import|More information]]. |
| Line 73: | Line 75: |
| IMAGE functional result_tree | . {{attachment:review_raw.png}} <<BR>> |
| Line 75: | Line 77: |
| === Display MEG helmet and sensors === | |
| Line 77: | Line 80: |
| IMAGE helmet and sensors | . {{attachment:helmet_sensors.png}} |
| Line 84: | Line 87: |
| IMAGE both MEG up, MEG down | . [[https://neuroimage.usc.edu/brainstorm/Tutorials/CorticomuscularCoherence?action=AttachFile&do=get&target=timeseries_meg_emg.png|{{attachment:timeseries_meg_emg.png|https://neuroimage.usc.edu/brainstorm/Tutorials/CorticomuscularCoherence?action=AttachFile&do=get&target=timeseries_meg_emg.png}}]] |
| Line 91: | Line 94: |
| IMAGE Menu and Process | . {{attachment:read_evnt_ch.png}} |
| Line 98: | Line 101: |
| IMAGE Left (x24) | . {{attachment:left_24.png}} |
| Line 105: | Line 108: |
| IMAGE Menu duplicate, menu offset, process offset | . {{attachment:dup_offset.png}} |
| Line 109: | Line 112: |
| IMAGE Left (x192) | . {{attachment:left_192.png}} |
| Line 111: | Line 114: |
| == Pre-process recordings == Two of the typical pre-processing steps consist in removing the power lines artifacts (50 Hz or 60Hz) and the frequencies we are not interested in (a low-pass filter to remove the high-frequency noise and a high-pass filter to remove the very slow components of the signals). Let's start with a spectral evaluation of this file. |
== Pre-process MEG recordings == Three of the typical pre-processing steps for MEG recordings consist in: |
| Line 114: | Line 117: |
| === Power spectrum === * In the Process1 box: Drag and drop the "Link to raw file". * Run process '''Frequency > Power spectrum density (Welch)''': All file, Length='''10s''', Overlap=50%.<<BR>> {{attachment:psd1.gif||width="510",height="305"}} * Double-click on the new PSD file to display it.<<BR>> {{attachment:psd2.gif||width="557",height="199"}} * This frequency spectrum does not show any particular peak at 50/60Hz, there is no notch filter to apply on these recordings. If we had to, we would run the process "Pre-processing > Notch filter" as explained in the tutorial [[Tutorials/ArtifactsFilter|Detect and remove artifacts]]. |
1. [[Tutorials/ArtifactsFilter|removing the power line artifacts]], 50 Hz for this recording |
| Line 120: | Line 119: |
| === Band-pass filter === The filters we selected for reviewing the recordings were for visualization only, they were not applied to the file. In order to apply these filters permanently to the recordings, we need to do the following: |
1. [[Tutorials/ArtifactsDetect|detection]] and [[Tutorials/ArtifactsSsp|removal of artifacts with SSP]] |
| Line 123: | Line 121: |
| * Keep the "Link to raw file" selected in the Process1 list. * Run process '''Pre-process > Band-pass filter''': '''[0.5,80]Hz''', 60dB, no mirror, sensors='''EEG'''<<BR>><<BR>> {{attachment:bandpass.gif}} |
1. [[Tutorials/BadSegments|detection of segments with other artifacts]]. |
| Line 126: | Line 123: |
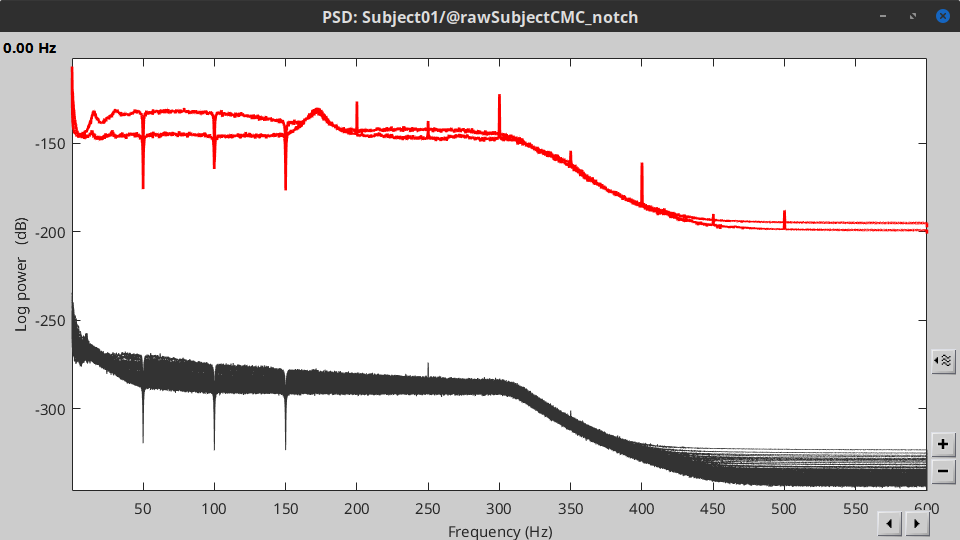
| * Note that this new continuous file is saved in your Brainstorm database, while the original file is saved in a separate folder (sample_epilepsy). If you delete the link to the original file with the database explorer, it would not delete the actual file. If you delete the link to the filtered file, it would delete the file itself. | First, to avoid an excessive requirement of memory during the pre-processing, we need to create an '''intermediate file''' for the '''Link to raw file'''. This intermediate file will contain the same data as the original `.ds` file, but with the CTF compensation projector applied to the recordings values (instead of being just saved as linear operators on the side). * In the Process1 box: Drag and drop the '''''Link to raw file'''''. * Run process '''''Artifacts > Apply SSP and CTF compensation''''' The intermediate file is located in named '''''Raw | clean''''' and is located in the the '''''SubjectCMC_clean''''' study. . {{attachment:cft_compensation_tree.png||width="100%"}} === Power line artifacts === Let's start with locating the spectral components and impact of the power line noise. * In the Process1 box: Drag and drop the '''''Raw | clean''''' node. * Run process '''''Frequency > Power spectrum density (Welch)''''':<<BR>> * '''All file''', '''Window length='''60 s and '''Overlap'''=50%.<<BR>> * Double-click on the new PSD file to display it.<<BR>> . {{attachment:psd_before_notch.png||width="70%"}} * The PSD shows prominent peaks at 50Hz, 150Hz and 250Hz. We will use notch filters to remove those frequency components from the MEG signals. Run the process '''''Pre-processing > Notch filter''''' with: <<BR>> * '''Frequencies to remove (Hz)''' = 50.00, 150.00, 250.00 . {{attachment:psd_process.png||width="40%"}} * Compute the PSD for the filtered MEG signals to verify effect of the notch the filters. . {{attachment:psd_after_notch.png||width="70%"}} |
| Line 141: | Line 161: |
| * Kilner JM, Baker SN, Salenius S, Hari R, Lemon RN. <<BR>> [[https://doi.org/10.1523/JNEUROSCI.20-23-08838.2000|Human Cortical Muscle Coherence Is Directly Related to Specific Motor Parameters]]. <<BR>> J Neurosci. 2000 Dec 1;20(23):8838–45. | * Kilner JM, Baker SN, Salenius S, Hari R, Lemon RN. <<BR>> [[https://doi.org/10.1523/JNEUROSCI.20-23-08838.2000|Human Cortical Muscle Coherence Is Directly Related to Specific Motor Parameters]]. <<BR>> J Neurosci. 2000 Dec 1;20(23):8838–45. '' '' |
| Line 143: | Line 163: |
| * Liu J, Sheng Y, Liu H. <<BR>> [[https://doi.org/10.3389/fnhum.2019.00100Corticomuscular%20Coherence%20and%20Its%20Applications:%20A%20Review|https://doi.org/10.3389/fnhum.2019.00100Corticomuscular%20Coherence%20and%20Its%20Applications:%20A%20Review]]. Front Hum Neurosci. 2019 Mar 20;13:100. | * ''Liu J, Sheng Y, Liu H. <<BR>> [[https://doi.org/10.3389/fnhum.2019.00100Corticomuscular%20Coherence%20and%20Its%20Applications:%20A%20Review|https://doi.org/10.3389/fnhum.2019.00100Corticomuscular%20Coherence%20and%20Its%20Applications:%20A%20Review]]. Front Hum Neurosci. 2019 Mar 20;13:100. '' |
| Line 145: | Line 165: |
| {{{#!wiki comment * Schoffelen J-M, Poort J, Oostenveld R, Fries P. <<BR>> [[https://doi.org/10.1523/JNEUROSCI.4882-10.2011|Selective Movement Preparation Is Subserved by Selective Increases in Corticomuscular Gamma-Band Coherence]]. Journal of Neuroscience. 2011 May 4;31(18):6750–8. }}} |
|
| Line 151: | Line 166: |
| * Tutorial: [[Tutorials/TutVolSource|Volume source estimation]] | * ''Tutorial: [[Tutorials/TutVolSource|Volume source estimation]] '' |
| Line 154: | Line 169: |
| * Forum: Minimum norm units (pA.m): [[http://neuroimage.usc.edu/forums/showthread.php?1246-Doubt-about-current-density-units-pA.m-or-pA-m2|http://neuroimage.usc.edu/forums/showthread.php?1246]] | * ''Forum: Minimum norm units (pA.m): [[http://neuroimage.usc.edu/forums/showthread.php?1246-Doubt-about-current-density-units-pA.m-or-pA-m2|http://neuroimage.usc.edu/forums/showthread.php?1246]] '' |
| Line 156: | Line 171: |
| <<HTML(<!-- END-PAGE -->)>> | ''<<HTML(<!-- END-PAGE -->)>> '' |
| Line 158: | Line 173: |
| <<EmbedContent(http://neuroimage.usc.edu/bst/get_feedback.php?Tutorials/CorticomuscularCoherence)>> | ''<<EmbedContent(http://neuroimage.usc.edu/bst/get_feedback.php?Tutorials/CorticomuscularCoherence)>> '' |
MEG corticomuscular coherence
[TUTORIAL UNDER DEVELOPMENT: NOT READY FOR PUBLIC USE]
Authors: Raymundo Cassani
Corticomuscular coherence relates to the synchrony between electrophisiological signals (MEG, EEG or ECoG) recorded from the contralateral motor cortex, and EMG signal from a muscle during voluntary movement. This synchrony has its origin mainly in the descending communication in corticospinal pathways between primary motor cortex (M1) and muscles. This tutorial replicates the processing pipeline and analysis presented in the Analysis of corticomuscular coherence FieldTrip tutorial.
Contents
Background
Coherence is a classic method to measure the linear relationship between two signals in the frequency domain. Previous studies (Conway et al., 1995, Kilner et al., 2000) have used coherence to study the relationship between MEG signals from M1 and muscles, and they have shown synchronized activity in the 15–30 Hz range during maintained voluntary contractions.
IMAGE OF EXPERIMENT, SIGNALS and COHERENCE
Dataset description
The dataset is comprised of MEG (151-channel CTF MEG system) and bipolar EMG (from left and right extensor carpi radialis longus muscles) recordings from one subject during an experiment in which the subject had to lift her hand and exert a constant force against a lever. The force was monitored by strain gauges on the lever. The subject performed two blocks of 25 trials in which either the left or the right wrist was extended for about 10 seconds. In addition to the MEG and EMG signals, EOG signal was recorded to assist the removal of ocular artifacts. Only data for the left wrist will be analyzed in this tutorial.
Download and installation
Requirements: You should have already followed all the introduction tutorials and you have a working copy of Brainstorm installed on your computer.
Download the dataset:
Download the SubjectCMC.zip file from FieldTrip FTP server: ftp://ftp.fieldtriptoolbox.org/pub/fieldtrip/tutorial/SubjectCMC.zip
- Unzip it in a folder that is not in any of the Brainstorm folders (program folder or database folder).
Brainstorm:
- Start Brainstorm (Matlab scripts or stand-alone version).
Select the menu File > Create new protocol. Name it TutorialCMC and select the options: No, use individual anatomy,
No, use one channel file per acquisition run.
The next sections will describe how to link import the subject's anatomy, reviewing raw data, managing event markers, pre-processing, epoching, source estimation and computation of coherence in the sensor and sources domain.
Importing anatomy data
Right-click on the TutorialCMC node then New subject > Subject01.
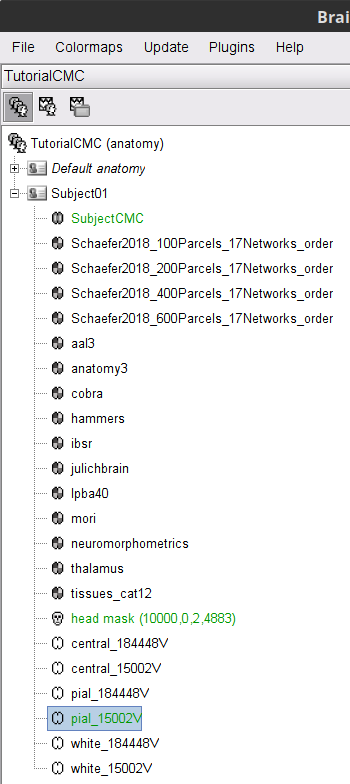
Keep the default options you defined for the protocol.Switch to the Anatomy view of the protocol.
Right-click on the Subject01 node then Import MRI:
Set the file format: All MRI file (subject space)
Select the file: SubjectCMC/SubjectCMC.mri
Compute MNI normalization, in the MRI viewer click on Click here to compute MNI normalization, use the maff8 method. When the normalization is complete, verify the correct location of the fiducials and click on Save.
Once the MRI has been imported and normalized, we will segment the head and brain tissues to obtain the surfaces that are needed for a realistic BEM forward model.
Right-click on the SubjectCMC MRI node, then MRI segmentation > FieldTrip: Tissues, BEM surfaces.
Select all the tissues (scalp, skull, csf, gray and white).
Click OK.
For the option Generate surface meshes select No.
After the segmentation is complete, a tissues node will be shown in the tree.
Rick-click on the tissues node and select Generate triangular meshes
- Select the 5 layers to mesh
Use the default parameters: number of vertices: 10,000; erode factor: 0; and fill holes factor 2.
As output, we get a set of (head and brain) surface files that will be used for BEM computation.
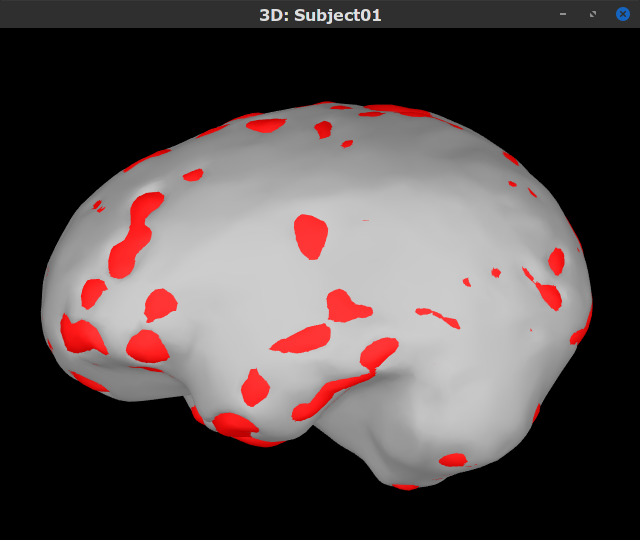
By displaying the surfaces, we can note that the cortex, which is related to the gray matter (shown in red) overlaps heavily with the innerskull surface (shown in gray), so it cannot be used it for BEM computation using OpenMEEG. However, as we are dealing with MEG signals, we can still compute the BEM with the overleaping-spheres method, and obtain similar results. We can also notice that the cortex and white surfaces obtained with the method above do not register accurately the cortical surface, they can be used for volume-based source estimation, which is based on a volume grid of source points; but they do not be used for surface-based source estimation. Better surface surfaces can be obtained by doing MRI segmentation with CAT12 or FreeSurfer.
Access the recordings
Link the recordings
Switch to the Functional data view (X button).
Right-click on the Subject01 node then Review raw file:
Select the file format: MEG/EEG: CTF(*.ds; *.meg4; *.res4)
Select the file: SubjectCMC.ds
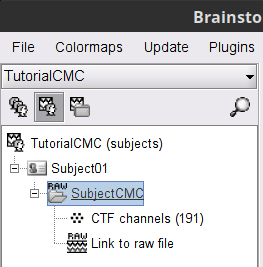
- A a new folder and its content is now visible in the database explorer:
The SubjectCMC folder represents the MEG dataset linked to the database. Note the tag "raw" in the icon of the folder, this means that the files are considered as new continuous files.
The CTF channels (191) node is the channel file and defines the types and names of channels that were recorded, the position of the sensors, the head shape and other various details. This information has been read from the MEG datasets and saved as a new file in the database. The total number of data channels recorded in the file is indicated between parenthesis (191).
The Link to raw file node is a link to the original file that was selected. All the relevant meta-data was read from the MEG dataset and copied inside the link itself (sampling rate, number of samples, event markers and other details about the acquisition session). As it is a link, no MEG recordings were copied to the database. When we open this file, the values are read directly from the original files in the .ds folder. More information.
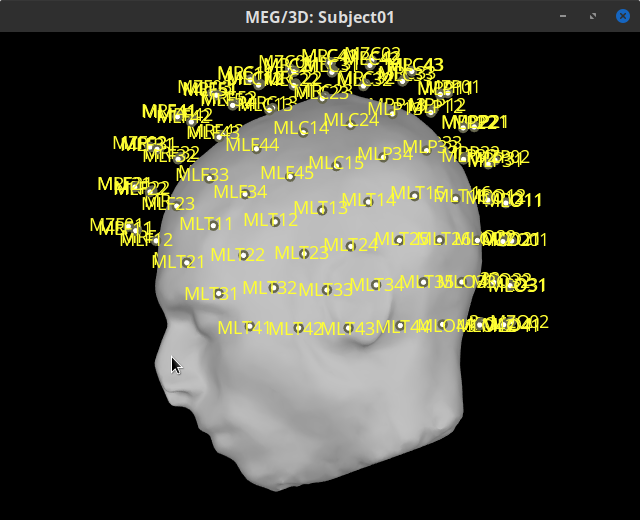
Display MEG helmet and sensors
Right-click on the CTF channels (191) node, then Display sensors > CTF helmet and Display sensors > MEG to show a surface that represents the inner surface the helmet, and the MEG sensors respectively. Try additional display menus.
Reviewing continuous recordings
Right-click on the Link to raw file node, then Switch epoched/continuous to convert the file to continuous.
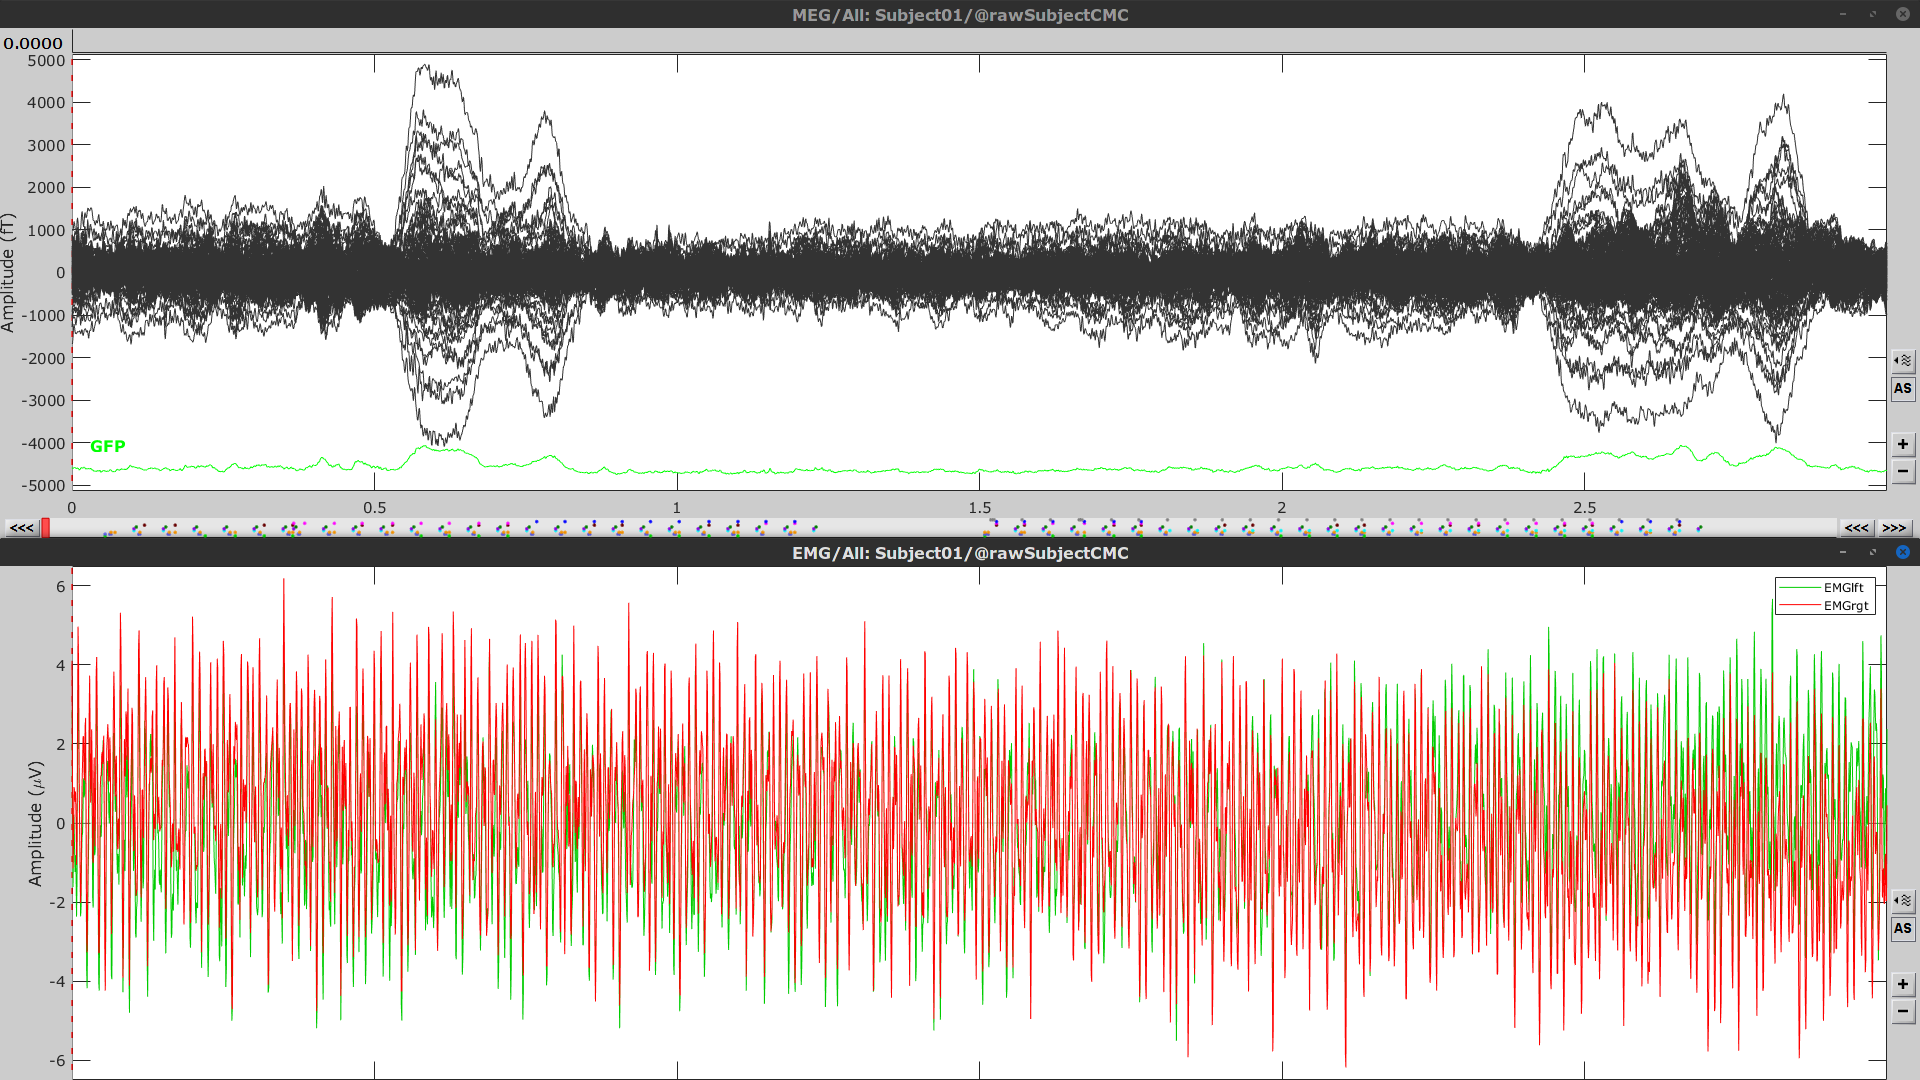
Right-click on the Link to raw file node, then MEG > Display time series (or double-click on the node). This will open a new time series figure and enable the Time panel and the Record tab in the main Brainstorm window. Controls in these two panels are used to explore the time series.
In addition we can display the EMG signals, right-click on the Link to raw file node, then EMG > Display time series.
Event markers
The colored dots on top of the recordings in the time series figures represent the event markers (or triggers) saved in this dataset. In addition to these events, the start of the either left or right trials is saved in the auxiliary channel named Stim. To add these markers:
With the time series figure open, in the Record tab go to File > Read events from channel. Now, in the options for the Read from channel process, set Event channels: to Stim, select Value, anc click Run.
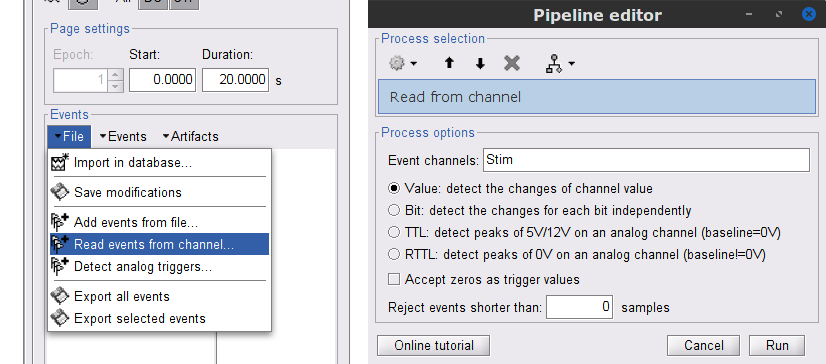
New events will appear, from these, we are only interested in the events from U1 to U25 that correspond to the 25 left trials. Thus we will remove the other events, and merge the left trial events.
Delete all the other events: select the events to delete with Ctrl+click, when done go the menu Events > Delete group and confirm. Alternatively, you can do Ctrl+A to select all the events and deselect the U1 to U25 events.
To be in line with the original FieldTrip tutorial, we will reject the trial 7. Select the events U1 to U6 and U8 to U25 events, then go the menu Events > Merge group and enter the label Left.
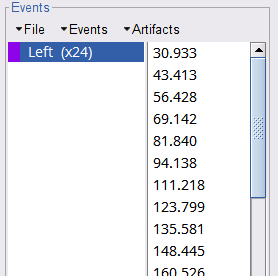
These events are located at the beginning of the 10 s trials of left wrist movement. In the following steps we will compute the coherence for 1 s epochs for the first 8 s of the trial, thus we need extra events.
Duplicate 7 times the Left events by selecting Duplicate group in the Events menu. This will create the groups Left_02 to Left_08.
To each copy of the Left events, we will add a time off, 1 s for Left02, 2 s for Left03, and so on. Select the event group to add the offset, then go to the menu Events > Delete group.
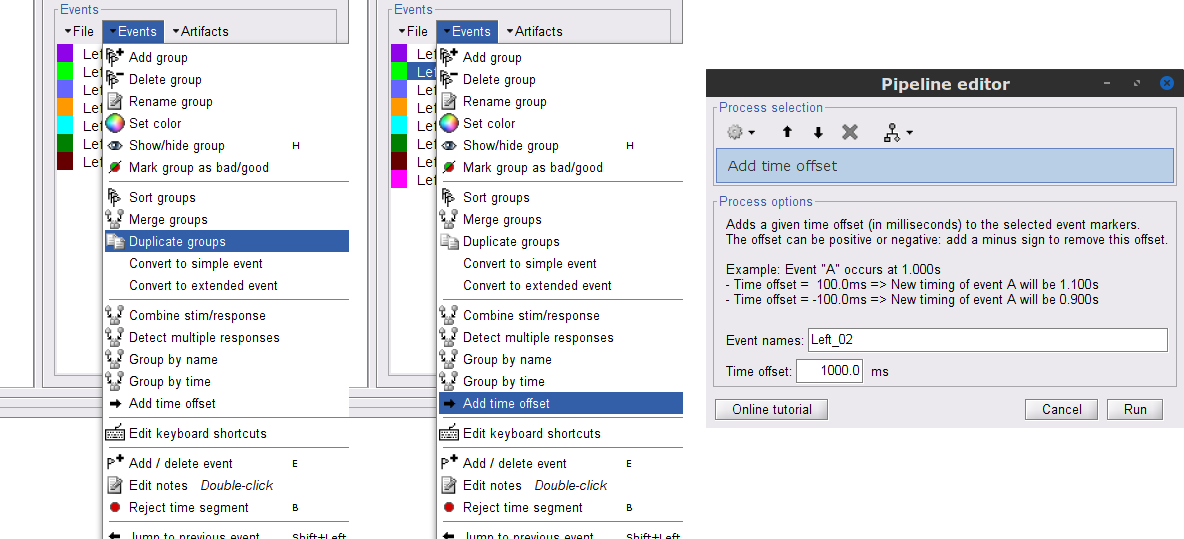
Finally merge all the Left events into Left, and select Save modifications in the File menu in the Record tab.
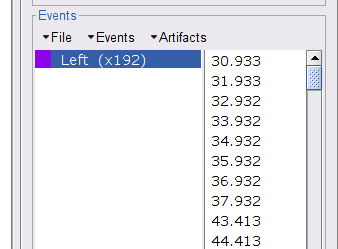
Pre-process MEG recordings
Three of the typical pre-processing steps for MEG recordings consist in:
removing the power line artifacts, 50 Hz for this recording
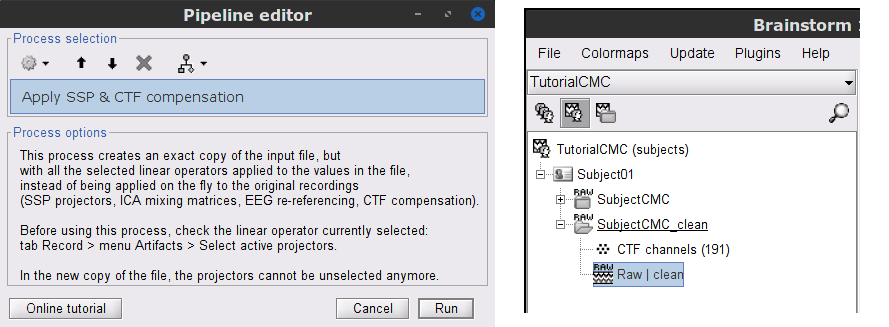
First, to avoid an excessive requirement of memory during the pre-processing, we need to create an intermediate file for the Link to raw file. This intermediate file will contain the same data as the original .ds file, but with the CTF compensation projector applied to the recordings values (instead of being just saved as linear operators on the side).
In the Process1 box: Drag and drop the Link to raw file.
Run process Artifacts > Apply SSP and CTF compensation
The intermediate file is located in named Raw | clean and is located in the the SubjectCMC_clean study.
Power line artifacts
Let's start with locating the spectral components and impact of the power line noise.
In the Process1 box: Drag and drop the Raw | clean node.
Run process Frequency > Power spectrum density (Welch):
All file, Window length=60 s and Overlap=50%.
Double-click on the new PSD file to display it.
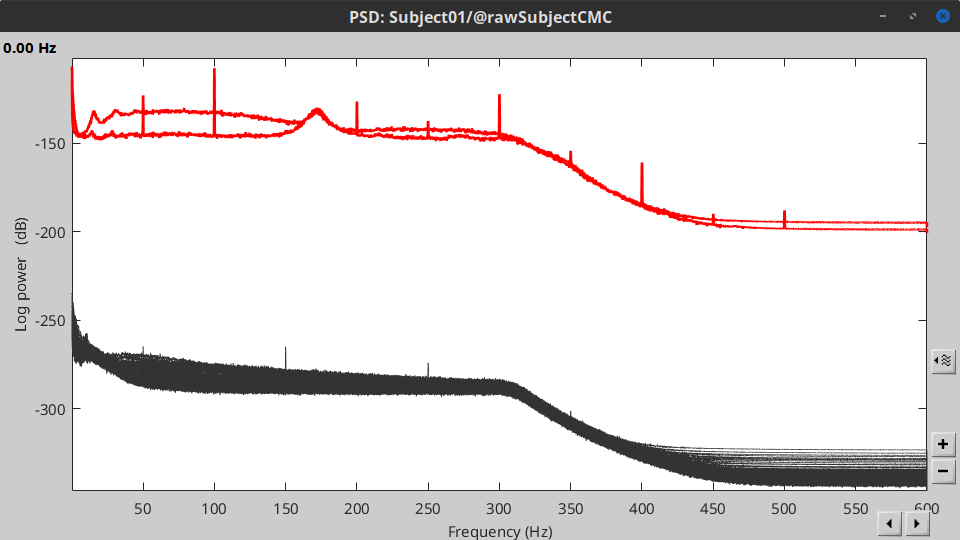
The PSD shows prominent peaks at 50Hz, 150Hz and 250Hz. We will use notch filters to remove those frequency components from the MEG signals. Run the process Pre-processing > Notch filter with:
Frequencies to remove (Hz) = 50.00, 150.00, 250.00
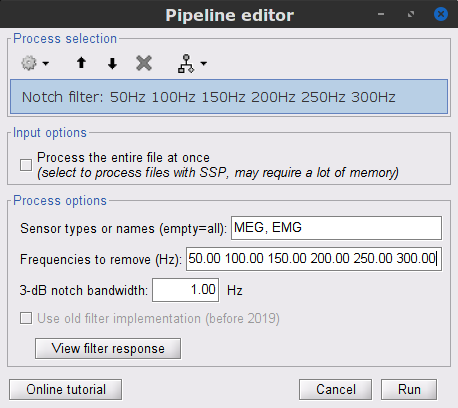
- Compute the PSD for the filtered MEG signals to verify effect of the notch the filters.
Importing the recordings
Epoching
Source analysis
Coherence
Sensor level
Source level
Script
This should be label as advanced.
Additional documentation
Articles
Conway BA, Halliday DM, Farmer SF, Shahani U, Maas P, Weir AI, et al.
Synchronization between motor cortex and spinal motoneuronal pool during the performance of a maintained motor task in man.
The Journal of Physiology. 1995 Dec 15;489(3):917–24.Kilner JM, Baker SN, Salenius S, Hari R, Lemon RN.
Human Cortical Muscle Coherence Is Directly Related to Specific Motor Parameters.
J Neurosci. 2000 Dec 1;20(23):8838–45.Liu J, Sheng Y, Liu H.
https://doi.org/10.3389/fnhum.2019.00100Corticomuscular%20Coherence%20and%20Its%20Applications:%20A%20Review. Front Hum Neurosci. 2019 Mar 20;13:100.
Tutorials
Tutorial: Volume source estimation
Forum discussions
Forum: Minimum norm units (pA.m): http://neuroimage.usc.edu/forums/showthread.php?1246

