|
Size: 28509
Comment:
|
Size: 35675
Comment:
|
| Deletions are marked like this. | Additions are marked like this. |
| Line 1: | Line 1: |
| <<HTML(<style>.backtick {font-size: 16px;}</style>)>><<HTML(<style>abbr {font-weight: bold;}</style>)>> <<HTML(<style>em strong {font-weight: bold; font-style: normal; padding: 2px; border-radius: 5px; background-color: #DDD; color: #111;}</style>)>> | <<HTML(<style>.backtick {font-size: 16px; font-weight: bold;}</style>)>><<HTML(<style>abbr {font-weight: bold;}</style>)>> <<HTML(<style>em strong {font-weight: bold; font-style: normal; padding: 2px; border-radius: 5px; background-color: #DDD; color: #111;}</style>)>> |
| Line 8: | Line 8: |
| [[https://en.wikipedia.org/wiki/Corticomuscular_coherence|Corticomuscular coherence]] relates to the synchrony between electrophisiological signals (MEG, EEG or ECoG) recorded from the contralateral motor cortex, and EMG signal from a muscle during voluntary movement. This synchrony has its origin mainly in the descending communication in corticospinal pathways between primary motor cortex (M1) and muscles. This tutorial replicates the processing pipeline and analysis presented in the [[https://www.fieldtriptoolbox.org/tutorial/coherence/|Analysis of corticomuscular coherence]] FieldTrip tutorial. | [[https://en.wikipedia.org/wiki/Corticomuscular_coherence|Corticomuscular coherence]] relates to the synchrony between electrophysiological signals (MEG, EEG or ECoG) recorded from the contralateral motor cortex, and EMG signal from a muscle during voluntary movement. This synchrony has its origin mainly in the descending communication in corticospinal pathways between primary motor cortex (M1) and muscles. This tutorial replicates the processing pipeline and analysis presented in the [[https://www.fieldtriptoolbox.org/tutorial/coherence/|Analysis of corticomuscular coherence]] FieldTrip tutorial. |
| Line 21: | Line 21: |
| * '''Requirements''': You should have already followed all the introduction tutorials and you have a working copy of Brainstorm installed on your computer. | * '''Requirements''': You should have already followed all the [[Tutorials|get-started tutorials]] and you have a working copy of Brainstorm installed on your computer. |
| Line 23: | Line 23: |
| * Download the `SubjectCMC.zip` file from FieldTrip FTP server: ftp://ftp.fieldtriptoolbox.org/pub/fieldtrip/tutorial/SubjectCMC.zip * Unzip it in a folder that is not in any of the Brainstorm folders (program folder or database folder). |
* Download the `SubjectCMC.zip` file from FieldTrip FTP server:<<BR>> ftp://ftp.fieldtriptoolbox.org/pub/fieldtrip/tutorial/SubjectCMC.zip * Unzip it in a folder that is not in any of the Brainstorm folders (program or database folder). |
| Line 27: | Line 27: |
| * Select the menu '''File > Create new protocol'''. Name it '''TutorialCMC''' and select the options: '''No, use individual anatomy''', <<BR>> '''No, use one channel file per acquisition run'''. The next sections will describe how to link import the subject's anatomy, reviewing raw data, managing event markers, pre-processing, epoching, source estimation and computation of coherence in the sensor and sources domain. |
* Select the menu '''''File > Create new protocol'''''. Name it `TutorialCMC` and select the options:<<BR>> '''No, use individual anatomy''', <<BR>> '''No, use one channel file per acquisition run'''. The next sections describe: importing the subject's anatomy, reviewing raw data, managing event markers, pre-processing the EMG and MEG signals, epoching and importing recordings, and computing coherence in the sensor and source level. |
| Line 32: | Line 32: |
| * Right-click on the '''TutorialCMC''' node then '''New subject > Subject01'''.<<BR>>Keep the default options you defined for the protocol. | * Right-click on the '''TutorialCMC''' node then '''''New subject > Subject01'''''.<<BR>>Keep the default options you defined for the protocol. |
| Line 35: | Line 35: |
| * Right-click on the '''Subject01''' node then '''Import MRI''': | * Right-click on the '''Subject01''' node then '''''Import MRI''''': |
| Line 46: | Line 46: |
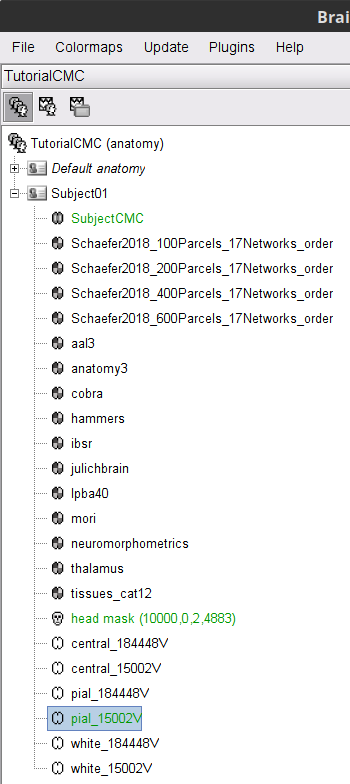
| * Once the MRI has been imported and normalized, we will segment the head and brain tissues to obtain the surfaces that are needed for a realistic [[Tutorials/TutBem|BEM forward model]]. * Right-click on the '''SubjectCMC''' MRI node, then '''MRI segmentation > FieldTrip: Tissues, BEM surfaces'''. * Select all the tissues ('''scalp''', '''skull''', '''csf''', '''gray''' and '''white'''). * Click '''OK'''. * For the option '''Generate surface meshes''' select '''No'''. * After the segmentation is complete, a '''tissues''' node will be shown in the tree. * Rick-click on the '''tissues''' node and select '''Generate triangular meshes''' * Select the 5 layers to mesh * Use the default parameters: '''number of vertices''': 10,000; '''erode factor''': 0; and '''fill holes factor''' 2. As output, we get a set of (head and brain) surface files that will be used for BEM computation. |
Once the MRI has been imported and normalized, we need to segment the head and brain tissues to obtain the surfaces that are needed to generate a realistic [[Tutorials/HeadModel|head model (or forward model)]]. * Right-click on the '''SubjectCMC''' MRI node, then '''''MRI segmentation > FieldTrip: Tissues, BEM surfaces'''''. * Select all the tissues ('''scalp''', '''skull''', '''csf''', '''gray''' and '''white'''). * Click '''OK'''. * For the option '''Generate surface meshes''' select '''No'''. * After the segmentation is complete, a '''tissues''' node will be shown in the tree. * Rick-click on the '''tissues''' node and select '''''Generate triangular meshes''''' * Select the 5 layers to mesh * Use the default parameters: * '''number of vertices''': `10,000` * '''erode factor''': `0` * '''fill holes factor''': `2` As output, there is a set of (head and brain) surface files that will be used for the head model computation. |
| Line 60: | Line 64: |
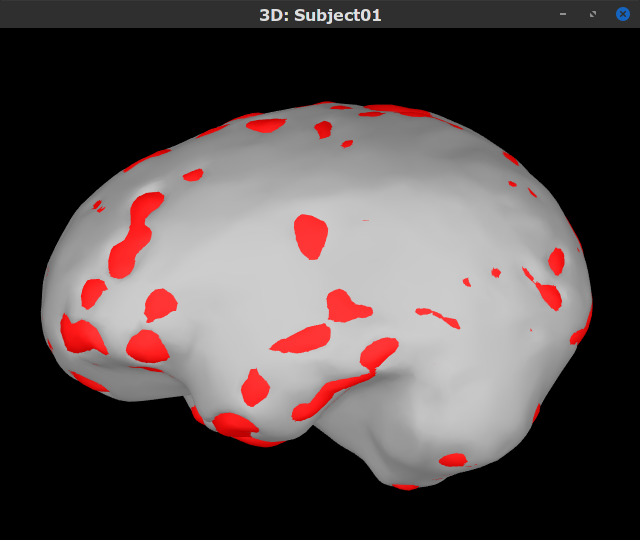
| By displaying the surfaces, we can note that the '''cortex''', which is related to the gray matter (shown in red) overlaps heavily with the '''innerskull''' surface (shown in gray), so it cannot be used it for [[Tutorials/TutBem|BEM computation using OpenMEEG]]. However, as we are dealing with MEG signals, we can still compute the BEM with the [[Tutorials/HeadModel#Forward_model|overleaping-spheres method]], and obtain similar results. We can also notice that the '''cortex''' and '''white''' surfaces obtained with the method above do not register accurately the cortical surface, they can be used for [[Tutorials/TutVolSource|volume-based source estimation]], which is based on a volume grid of source points; but they do not be used for surface-based source estimation. Better surface surfaces can be obtained by doing MRI segmentation with [[Tutorials/SegCAT12|CAT12]] or [[Tutorials/LabelFreeSurfer|FreeSurfer]]. | By displaying the surfaces, we can note that the '''cortex''', which is related to the gray matter (shown in red) overlaps heavily with the '''innerskull''' surface (shown in gray), so it cannot be used to compute a [[Tutorials/TutBem|BEM forward model using OpenMEEG]]. However, as we are dealing with MEG signals, we can still compute the forward model with the [[Tutorials/HeadModel#Forward_model|overlapping-spheres method]], and obtain similar results. We can also notice that the '''cortex''' and '''white''' surfaces obtained with the method above do not register accurately the cortical surface, they can be used for [[Tutorials/TutVolSource|volume-based source estimation]], which is based on a volume grid of source points; but they may not be used for surface-based source estimation. Better surfaces can be obtained by doing MRI segmentation with [[Tutorials/SegCAT12|CAT12]] or [[Tutorials/LabelFreeSurfer|FreeSurfer]]. |
| Line 63: | Line 67: |
As the imported anatomy data is normalized in the MNI space, it is possible to apply use [[Tutorials/DefaultAnatomy#MNI_parcellations|MNI parcellation]] templates to define anatomical regions of the brain of the subject. These anatomical regions can be used to create [[Tutorials/TutVolSource#Volume_atlases|volume]] and [[Tutorials/Scouts|surface scouts]], which are convenient when performing the coherence analysis in the source level. Let's add the [[https://www.gin.cnrs.fr/en/tools/aal/|AAL3]] parcellation to the imported data. * Right-click on Subject01 then go to the menu '''''Add MNI parcellation > AAL3'''''. The menu will appear as '''''Download: AAL3''''' if the atlas is not in your system. Once the MNI atlas is downloaded, an atlas node (ICON) appears in the database explorer and the atlas is displayed in the the MRI viewer. . {{attachment:gui_mni_aal3.png}} <<BR>> |
|
| Line 67: | Line 77: |
| * Right-click on the '''Subject01''' node then '''Review raw file''': | * Right-click on the '''Subject01''' node then '''''Review raw file''''': |
| Line 70: | Line 80: |
| * A a new folder and its content is now visible in the database explorer: * The '''SubjectCMC''' folder represents the MEG dataset linked to the database. Note the tag "raw" in the icon of the folder, this means that the files are considered as new continuous files. * The '''CTF channels (191)''' node is the '''channel file''' and defines the types and names of channels that were recorded, the position of the sensors, the head shape and other various details. This information has been read from the MEG datasets and saved as a new file in the database. The total number of data channels recorded in the file is indicated between parenthesis (191). * The '''Link to raw file''' node is a '''link to the original file''' that was selected. All the relevant meta-data was read from the MEG dataset and copied inside the link itself (sampling rate, number of samples, event markers and other details about the acquisition session). As it is a link, no MEG recordings were copied to the database. When we open this file, the values are read directly from the original files in the .ds folder. [[Tutorials/ChannelFile#Review_vs_Import|More information]]. |
A new folder and its content are now visible in the database explorer: * The '''SubjectCMC''' folder represents the MEG dataset linked to the database. Note the tag "RAW" in the icon of the folder, this means that the files are considered as raw continuous files. * The '''CTF channels (191)''' node is the '''channel file''' and defines the types and names of channels that were recorded, the position of the sensors, the head shape and other various details. This information has been read from the MEG datasets and saved as a new file in the database. The total number of data channels recorded in the file is indicated between parenthesis '''(191)'''. * The '''Link to raw file''' node is a '''link to the original file''' that was selected. All the relevant metadata was read from the MEG dataset and copied inside the link itself (sampling rate, number of samples, event markers and other details about the acquisition session). As it is a link, no MEG recordings were copied to the database. When we open this file, the values are read directly from the original files in the .ds folder. [[Tutorials/ChannelFile#Review_vs_Import|More information]]. |
| Line 78: | Line 90: |
| * Right-click on the '''CTF channels (191)''' node, then '''Display sensors > CTF helmet''' and '''Display sensors > MEG ''' to show a surface that represents the inner surface the helmet, and the MEG sensors respectively. Try [[Tutorials/ChannelFile#Display_the_sensors|additional display menus]]. | * Right-click on the '''CTF channels (191)''' node, then '''''Display sensors > CTF helmet''''' and '''''Display sensors > MEG ''''' to show a surface that represents the inner surface the helmet, and the MEG sensors respectively. Try [[Tutorials/ChannelFile#Display_the_sensors|additional display menus]]. |
| Line 83: | Line 95: |
| * Right-click on the '''Link to raw file''' node, then '''Switch epoched/continuous''' to convert the file to '''continuous'''. * Right-click on the '''Link to raw file''' node, then '''MEG > Display time series''' (or double-click on the node). This will open a new time series figure and enable the '''Time panel''' and the '''Record''' tab in the main Brainstorm window. Controls in these two panels are used to [[Tutorials/ReviewRaw|explore the time series]]. * In addition we can display the EMG signals, right-click on the '''Link to raw file''' node, then '''EMG > Display time series'''. |
* Right-click on the '''Link to raw file''' node, then '''''Switch epoched/continuous''''' to convert the file to '''continuous'''. * Right-click on the '''Link to raw file''' node, then '''''MEG > Display time series''''' (or double-click on the node). This opens a new time series figure and enable the '''''Time''''' panel and the '''''Record''''' tab in the main Brainstorm window. Controls in this panel and tab are used to [[Tutorials/ReviewRaw|explore the time series]]. * In addition we can display the EMG signals, right-click on the '''Link to raw file''' node, then '''''EMG > Display time series'''''. |
| Line 92: | Line 104: |
| * With the time series figure open, in the '''Record''' tab go to '''File > Read events from channel'''. Now, in the options for the '''Read from channel''' process, set '''Event channels''': to `Stim`, select '''Value''', anc click '''Run'''. | * With the time series figure open, in the '''''Record''''' tab go to '''''File > Read events from channel'''''. Now, in the options for the '''Read from channel''' process, set '''Event channels''' = `Stim`, select '''Value''', and click '''Run'''. |
| Line 96: | Line 108: |
| New events will appear, from these, we are only interested in the events from '''U1''' to '''U25''' that correspond to the 25 left trials. Thus we will remove the other events, and merge the left trial events. * Delete all the other events: select the events to delete with '''Ctrl+click''', when done go the menu '''Events > Delete group''' and confirm. Alternatively, you can do '''Ctrl+A''' to select all the events and deselect the '''U1''' to '''U25''' events. |
This creates new events shown in the '''''Events''''' section of the tab. We are only interested in the events from '''U1''' to '''U25''' that correspond to the 25 left trials. Thus we will delete the other events, and merge the left trial events. * Delete all the other events: select the events to delete with '''Ctrl+click''', when done go the menu '''''Events > Delete group''''' and confirm. Alternatively, you can do '''Ctrl+A''' to select all the events and then deselect the '''U1''' to '''U25''' events. |
| Line 103: | Line 115: |
| These events are located at the beginning of the 10 s trials of left wrist movement. In the following steps we will compute the coherence for 1 s epochs for the first 8 s of the trial, thus we need extra events. * Duplicate 7 times the '''Left''' events by selecting '''Duplicate group''' in the '''Events''' menu. This will create the groups '''Left_02 to Left_08'''. * To each copy of the '''Left''' events, we will add a time off, 1 s for '''Left02''', 2 s for '''Left03''', and so on. Select the event group to add the offset, then go to the menu '''Events > Delete group'''. |
These events are located at the beginning of the 10 s trials of left wrist movement. In the sections below, we will compute the coherence for 1 s epochs for the first 8 s of the trial, thus we need to create extra events. * Duplicate 7 times the '''Left''' events by selecting '''''Duplicate group''''' in the '''''Events''''' menu. The groups '''Left_02''' to '''Left_08''' will be created. * For each copy of the '''Left''' events, we need to add a time offset of 1 s for '''Left02''', 2 s for '''Left03''', and so on. Select the event group to add the offset, then go to the menu '''''Events > Delete group'''''. |
| Line 110: | Line 122: |
| * Finally merge all the '''Left''' events into '''Left''', and select '''Save modifications''' in the '''File''' menu in the '''Record tab'''. | * Finally, merge all the '''Left*''' events into '''Left''', and select '''''Save modifications''''' in the '''''File''''' menu in the '''''Record''''' tab. |
| Line 114: | Line 126: |
| {{{#!wiki comment | |
| Line 127: | Line 140: |
| }}} | |
| Line 129: | Line 142: |
| {{{#!wiki note In this tutorial will be analyzing only the '''Left''' trials. As such, in the following sections we will process only the first '''330 s''' of the recordings. }}} The CTF MEG recordings in this dataset were not saved with the desired 3rd order compensation. To continue with the pre-processing we need to apply the compensation. * In the '''''Process1''''' box: Drag and drop the '''Link to raw file''' node. * Run process '''''Artifacts > Apply SSP & CTF compensation''''':<<BR>> . {{attachment:pro_ctf_compensation.png||width="50%"}} This process create the '''SubjectCMC_clean''' folder that contains a copy of the '''channel file''' and the raw recordings file '''Raw | clean''', which is de exact copy of the original data but with the CTF compensation applied. . {{attachment:tre_raw_clean.png||width="40%"}} |
|
| Line 132: | Line 159: |
| * In the Process1 box: Drag and drop the '''Link to raw file''' node. | * In the '''''Process1''''' box: Drag and drop the '''Raw | clean''' node. |
| Line 134: | Line 161: |
| * '''All file''', '''Window length='''`10 s`, '''Overlap'''=`50%`, and '''Sensor types'''=`MEG, EMG`<<BR>> * Double-click on the new PSD file to display it.<<BR>> |
* '''Time window''': `0 - 330 s` * '''Window length='''`10 s` * '''Overlap'''=`50%` * '''Sensor types'''=`MEG, EMG . {{attachment:pro_psd.png||width="50%"}} * Double-click on the new '''PSD''' file to display it.<<BR>> |
| Line 138: | Line 171: |
| * The PSD shows two groups of sensors, EMG on top and MEG in the bottom. Also, there are peaks at 50Hz and its harmonics. We will use notch filters to remove those frequency components from the signals. * Run the process '''Pre-processing > Notch filter''' with: <<BR>> * '''Sensor types''' = `MEG, EMG` and '''Frequencies to remove (Hz)''' = `50, 100, 150, 200, 250, 300` . {{attachment:psd_process.png||width="50%"}} * Compute the PSD for the filtered signals to verify effect of the notch the filters. |
* The PSD shows two groups of sensors, EMG on top and MEG in the bottom. Also, there are peaks at 50Hz and its harmonics. We will use notch filters to remove the power line component and its first two components from the signals. * Run the process '''''Pre-processing > Notch filter''''' with: <<BR>> * '''Sensor types''' = `MEG, EMG` * '''Frequencies to remove (Hz)''' = `50, 100, 150` . {{attachment:pro_notch.png||width="50%"}} A new '''raw''' folder named SubjectCMC_clean_notch will appear in the database explorer. Compute the PSD for the filtered signals to verify effect of the notch filters. Remember to compute for the '''Time window''' from 0 to 330 s. |
| Line 150: | Line 186: |
| * In the Process1 box: Drag and drop the '''Raw | notch(50Hz 100Hz 150Hz 200Hz 250Hz 300Hz)'''. * Add the process '''Pre-process > Band-pass filter''' * '''Sensor types''' = `EMG`, '''Lower cutoff frequency''' = `10 Hz`, '''Upper cutoff frequency''' = `0 Hz` * Add the process '''Pre-process > Absolute values''' |
* In the '''''Process1''''' box: drag and drop the '''Raw | notch(50Hz 100Hz 150Hz)''' recordings node. * Add the process '''''Pre-process > Band-pass filter''''' |
| Line 155: | Line 189: |
| * '''Lower cutoff frequency''' = `10 Hz` * '''Upper cutoff frequency''' = `0 Hz` * Add the process '''''Pre-process > Absolute values''''' * '''Sensor types''' = `EMG` * Run the pipeline |
|
| Line 157: | Line 199: |
| * Once the pipeline runs, the following report will appear. It contains '''warnings''' on the fact that applying absolute value to raw recordings is not recommended. We can safely ignore these warnings as we do want to rectify the EMG signals. . {{attachment:report.png||width="70%"}} * To do some cleaning we will remove the '''block001_notch_high''' condition. |
Once the pipeline ends, the new folders '''SubjectCMC_clean_notch_high''' and '''SubjectCMC_clean_notch_high_abs''' are added to the database explorer. To avoid any confusion later, we can delete folders that will not be needed. * Delete the conditions '''SubjectCMC_clean_notch''' and '''SubjectCMC_clean_notch_high'''. Select both folders containing and press Delete (or right-click '''''File > Delete'''''). |
| Line 163: | Line 204: |
| After applying the notch filter to the MEG signals, we still need to remove other artifacts, thus we will perform: 1. [[Tutorials/ArtifactsDetect|detection]] and [[Tutorials/ArtifactsSsp|removal of artifacts with SSP]] 1. [[Tutorials/BadSegments|detection of segments with other artifacts]]. ==== Detection and removal of ocular artifacts ==== * Display the MEG and EOG time series. Right-click on the filtered continuous file '''Raw | notch(...''' (in the '''block001_notch_high_abs''' condition), then '''MEG > Display time series''' and '''EOG > Display time series'''. * From the '''Artifacts''' menu in the '''Record''' tab, select '''Artifacts > Detect eye blinks''', and use the parameters: * '''Channel name'''= EOG, '''All file''' and '''Event name'''=blink. |
After applying the notch filter to the MEG signals, we still need to remove other type of artifacts, we will perform: 1. '''Detection and removal of artifacts with SSP''' 1. '''Detection of segments with other artifacts''' ==== Detection and removal of artifacts with SSP ==== In the case of stereotypical artifacts, as it is the case of the eye blinks and heartbeats, it is possible to identify their characteristic spatial distribtuion, and then remove it from MEG signals with methods such as Signal-Space Projection (SSP). For more details, consult the tutorials on [[Tutorials/ArtifactsDetect|detection]] and [[Tutorials/ArtifactsSsp|removal of artifacts with SSP]]. The dataset of this tutorial contains an EOG channel but not ECG signal, thus will perform only removal of eye blinks. * Display the MEG and EOG time series. Right-click on the pre-processed (for EMG) continuous file '''Raw | clean | notch(...''' (in the '''SubjectCMC_clean_notch_high_abs''' folder) then '''''MEG > Display time series''''' and '''''EOG > Display time series'''''. * In the '''Events''' section of the '''''Record''''' tab, select '''''Artifacts > Detect eye blinks''''', and use the parameters: * '''Channel name'''= `EOG` * '''Time window''' = `0 - 330 s` * '''Event name''' = `blink` |
| Line 181: | Line 226: |
| * To [[Tutorials/ArtifactsSsp|remove blink artifacts with SSP]] go to '''Artifacts > SSP: Eyeblinks''', and use the parameters: * '''Event name'''=`blink`, '''Sensors'''=`MEG`, and check '''Compute using existing SSP''' |
* To [[Tutorials/ArtifactsSsp|remove blink artifacts with SSP]] go to '''''Artifacts > SSP: Eyeblinks''''', and use the parameters: * '''Event name'''=`blink` * '''Sensors'''=`MEG` * Check '''Compute using existing SSP/ICA projectors''' |
| Line 190: | Line 237: |
| * Follow the same procedure for the other blink events. Note that none of first two components for the remaining blink events is clearly related to a ocular artifacts. This figure shows the first two components for the '''blink2''' group. | * Follow the same procedure for the other blink events ('''blink2''' and '''blink3'''). Note that none of first two components for the remaining blink events is clearly related to a ocular artifacts. This figure shows the first two components for the '''blink2''' group. |
| Line 200: | Line 247: |
| ==== Other artifacts ==== Here we will used automatic detection of artifacts, it aims to identify typical artifacts such as the ones related to eye movements, subject movement and muscle contractions. * Display the MEG and EOG time series. In the '''Record tab''', select '''Artifacts > Detect other artifacts''', use the following parameters: * '''All file''', '''Sensor types'''=`MEG`, '''Sensitivity'''=`3` and check both frequency bands '''1-7 Hz''' and '''40-240 Hz'''. |
==== Detection of segments with other artifacts ==== Here we will used [[Tutorials/BadSegments#Automatic_detection|automatic detection of artifacts]]. It aims to identify typical artifacts such as the ones related to eye movements, subject movement and muscle contractions. * Display the MEG and EOG time series. In the '''''Record''''' tab, select '''''Artifacts > Detect other artifacts''''', use the following parameters: * '''Time window''' = `0 - 330 s` * '''Sensor types'''=`MEG` * '''Sensitivity'''=`3` * Check both frequency bands '''1-7 Hz''' and '''40-240 Hz''' |
| Line 208: | Line 258: |
| * While this process can help identify segments with artifacts in the signals, it is still advised to review the selected segments. After a quick browse, it can be noted that the selected segments correspond to irregularities in the MEG signal. * To label these events as bad, select them both in the events list and use the menu '''Events > Mark group as bad'''. Alternatively, you can rename the events and add the tag "bad_" in their name, it would have the same effect. |
While this process can help identify segments with artifacts in the signals, it is still advised to review the selected segments. After a quick browse, it can be noticed that the selected segments indeed correspond to irregularities in the MEG signal. Then, we will label these events are bad. * Select the '''1-7Hz''' and '''40-240Hz''' event groups and use the menu '''''Events > Mark group as bad'''''. Alternatively, you can rename the events and add the tag '''bad_''' in their name, it would have the same effect. |
| Line 217: | Line 267: |
| At this point we have finished with the pre-processing of our recordings. Many operations operations can only be applied to short segments of recordings that have been imported in the database. We will refer to these as "epochs" or "trials". Thus, the next step is to import the data taking into account the '''Left''' events. * Right-click on the filtered continuous file '''Raw | notch(...''' (in the '''block001_notch_high_abs''' condition), then '''Import in database'''. |
At this point we have finished with the pre-processing of our EMG and MEG recordings. Many operations operations can only be applied to short segments of recordings that have been imported in the database. We refer to these as '''epochs''' or '''trials'''. Thus, the next step is to import the data taking into account the '''Left''' events. * Right-click on the filtered continuous file '''Raw | clean | notch(...''' (in the '''SubjectCMC_clean_notch_high_abs''' condition), then '''''Import in database'''''. |
| Line 223: | Line 273: |
| * Set the import options as described below: | * Set the following parameters: * '''Time window''' = `0 - 330 s` * Check '''Use events''' and highlight the '''Left(x192)''' event group * '''Epoch time''' = `0 - 1000 ms` * Check '''Apply SSP/ICA projectors''' * Check '''Remove DC offset''' and select '''All recordings''' |
| Line 227: | Line 282: |
| The new folder '''block001_notch_high_abs''' appears in '''Subject01'''. It contains a copy of the channel file in the continuous file, and the '''Left''' trial group. By expanding the trial group, we can notice that there are trials marked with an interrogation sign in a red circle (ICON). These '''bad''' trials are the ones that were overleaped with the '''bad''' segments identified in the previous section. All the bad trials are automatically ignored in the '''Process''' panel. | The new folder '''SubjectCMC_clean_notch_high_abs''' appears for '''Subject01'''. It contains a copy of the '''channel file''' in the continuous file, and the '''Left''' trial group. By expanding the trial group, we can notice that there are trials marked with an interrogation sign in a red circle (ICON). These '''bad''' trials are the ones that were overlapped with the '''bad''' segments identified in the previous section. All the bad trials are automatically ignored in the '''''Process1''''' and '''''Process2''''' tabs. |
| Line 232: | Line 287: |
| Here, we'll compute magnitude square coherence (MSC) between the '''left EMG''' and the signals from each of the MEG sensors. * In the '''Process1''' box, drag-and-drop the '''Left (192 files)''' trial group. Note that the number between square brackets is '''[185]''', as the 7 '''bad''' trials are ignored. |
Once we have imported the trials, we will compute the '''magnitude square coherence (MSC)''' between the '''left EMG''' signal and the signals from each of the MEG sensors. * In the '''''Process1''''' box, drag and drop the '''Left (192 files)''' trial group. Note that the number between square brackets is '''[185]''', as the 7 '''bad''' trials are ignored. |
| Line 237: | Line 292: |
| * To compute the coherence between MEG and EMG signals. Run the process '''Connectivity > Coherence 1xN [2021]''' with the following parameters: * '''All file''', '''Source channel''' = `EMGlft`, do not '''Include bad channels''' nor '''Remove evoke response''', '''Magnitude squared coherence''', '''Window lenght''' = `0.5 s`, '''Overlap''' = `50%`, '''Highest frequency''' = `80 Hz`, and '''Average cross-spectra'''. |
* To compute the coherence between EMG and MEG signals. Run the process '''''Connectivity > Coherence 1xN [2021]''''' with the following parameters: * '''Time window''' = `0 - 1000 ms` or check '''All file''' * '''Source channel''' = `EMGlft` * Do not check '''Include bad channels''' nor '''Remove evoke response''' * '''Magnitude squared coherence''' * '''Window length for PSD estimation''' = `0.5 s` * '''Overlap for PSD estimation''' = `50%` * '''Highest frequency of interest''' = `80 Hz` * '''Average cross-spectra of input files (one output file)''' |
| Line 243: | Line 305: |
| * Double-click on the resulting node '''mscohere(0.6Hz,555win): EMGlft''' to display the coherence spectra. Click on the maximum peak in the 15 to 20 Hz range, and press `Enter` to plot it in a new figure. The spectrum corresponds to channel MRC21, with its peak at 17.58 Hz. Right-click on the spectrum and select '''2D Sensor cap''' for a spatial visualization of the coherence results, alternatively, the short cut `Ctrl-T` can be used. | * Double-click on the resulting node '''mscohere(0.6Hz,555win): EMGlft''' to display the MSC spectra. Click on the maximum peak in the 15 to 20 Hz range, and press `Enter` to plot it in a new figure. This spectrum corresponds to channel '''MRC21''', and has its peak at 17.58 Hz. You can also use the frequency slider (below the '''''Time''''' panel) to explore the spectral representations. * Right-click on the spectrum and select '''2D Sensor cap''' for a spatial visualization of the coherence results, alternatively, the short cut `Ctrl-T` can be used. Once the '''2D Sensor cap''' is show, the sensor locations can be displayed with right-click then '''''Channels > Display sensors''''' or the shortcut `Ctrl-E`. |
| Line 247: | Line 311: |
| The results above are based in the identification of single peak, as alternative we can compute the average coherence in a given frequency band, and observe its topographical distribution. | The results above are based in the identification of single peak, as alternative we can average the MSC in a given frequency band (15 - 20 Hz), and observe its topographical distribution. * In the '''''Process1''''' box, drag-and-drop the '''mscohere(0.6Hz,555win): EMGlft''' node, and add the process '''''Frequency > Group in time or frequency bands''''' with the parameters: * Select '''Group by frequency''' * Type `cmc_band / 15, 20 / mean` in the text box. |
| Line 251: | Line 319: |
| * In the '''Process1''' box, drag-and-drop the '''mscohere(0.6Hz,555win): EMGlft''', and add the process '''Frequency > Group in time or frequency bands''' with the parameters: * Select '''Group by frequency''', and type `cmc_band / 15, 20 / mean` in the text box. This will compute the mean of the coherence in the 15 to 20 Hz band. * Since our resulting file '''mscohere(0.6Hz,555win): EMGlft | tfbands''' is only one coherence value for each sensor, it is more useful to display in a spatial representation, for example '''2D Sensor cap'''. Sensor MRC21 is selected as reference. . {{attachment:res_coh_meg_emgleft1521.png||width="40%"}} In agreement with the literature, we observe a higher coherence between the EMG signal and the MEG signal from sensors over the contralateral primary motor cortex in the beta band range. In the next sections we will perform source estimation and compute coherence in the source level. |
The resulting file '''mscohere(0.6Hz,555win): EMGlft | tfbands''' has only one MSC value for each sensor (the average in the 15-20 Hz band). Thus, it is more useful to display the result in a spatial representation. Brainstorm provides 3 spatial representations: '''2D Sensor cap''', '''2D Sensor cap''' and '''2D Disk''', which are accessible with right-click on the MSC node. Sensor '''MRC21''' is selected as reference. . {{attachment:res_coh_meg_emgleft1520.png||width="100%"}} In agreement with the literature, we observe higher MSC values between the EMG signal and the MEG signal for MEG sensors over the contralateral primary motor cortex in the beta band range. In the next sections we will perform source estimation and compute coherence in the source level. |
| Line 261: | Line 326: |
| Before estimating the brain source, we need to compute the '''head model''' and the '''noise covariance'''. | In this tutorial we will perform source modelling using the [[Tutorials/HeadModel#Dipole_fitting_vs_distributed_models|distributed model]] approach for two sources spaces: '''cortex surface''' and '''MRI volume'''. In the first one the location of the sources is constrained to the cortical surface obtained when the subject anatomy was imported. For the second source space, the sources are uniformly distributed in the entire brain volume. Before estimating the brain sources, we need to compute '''head model''' and the '''noise covariance'''. Note that a head model is required for each source space. |
| Line 264: | Line 329: |
| The head model describes how neural electric currents produce magnetic fields and differences in electrical potentials at external sensors, given the different head tissues. This model is independent of sensor recordings. See the [[Tutorials/HeadModel|head model tutorial]] for more details. * In the '''block001_notch_high_abs''', right click the '''CTF channels (191)''' node and select '''Compute head model'''. Keep the default options: '''Source space''' = `Cortex`, and '''Forward model''' = `Overlapping spheres`. As result will have the '''Overlapping spheres''' head model in the database explorer. . {{attachment:pro_head_model.png||width="90%"}} |
The head model describes how neural electric currents produce magnetic fields and differences in electrical potentials at external sensors, given the different head tissues. This model is independent of sensor recordings. See the [[Tutorials/HeadModel|head model tutorial]] for more details. Each source space, requires its own head model. ==== Cortex surface ==== * In the '''SubjectCMC_clean_notch_high_abs''', right-click the '''CTF channels (191)''' node and select '''''Compute head model'''''. Keep the default options: * '''Comment''' = `Overlapping spheres (surface)` * '''Source space''' = `Cortex surface` * '''Forward model''' = `Overlapping spheres`. Keep in mind that the number of sources (vertices) in this head model is '''10,000''', and was defined when when the subject anatomy was imported. . {{attachment:pro_head_model_srf.png||width="40%"}} The (ICON) '''Overlapping spheres (surface)''' head model will appear in the database explorer. ==== MRI volume ==== * In the '''SubjectCMC_clean_notch_high_abs''', right-click the '''CTF channels (191)''' node and select '''''Compute head model'''''. Keep the default options: * '''Comment''' = `Overlapping spheres (volume)` * '''Source space''' = `MRI volume` * '''Forward model''' = `Overlapping spheres`. . {{attachment:pro_head_model_vol.png||width="40%"}} * The '''Volume source grid''' window pop-up, to define the volume grid. Use the following parameters, that will lead to an estimated number of '''12,200''' grid points. * Select '''Regular grid''' and '''Brain''' * '''Grid resolution''' = `5 mm` . {{attachment:pro_grid_vol.png||width="50%"}} The '''Overlapping spheres (volume)''' node will be added to the database explorer. The green color indicates the default head model for the folder. . {{attachment:tre_head_models.png||width="50%"}} |
| Line 271: | Line 362: |
| For MEG it is recommended to derive the noise covariance from empty room recordings. However, as we don't have those recordings in the dataset, we compute the noise covariance from the MEG signals before the trials. See the [[Tutorials/NoiseCovariance|noise covariance tutorial]] for more details. * In the raw '''block001_notch_high_abs''', right click the '''Raw | notch(...''' node and select '''Noise covariance > Compute from recordings''''. As parameters select a '''Baseline''' from `12 - 30 s`, and the '''Block by block''' option. . {{attachment:pro_noise_cov.png||width="40%"}} * Lastly, we need to copy the '''Noise covariance''' node to the '''block001_notch_high_abs''' folder with the head model. This can be done with the shortcuts `Ctrl-C` and `Ctrl-V`. |
For MEG recordings it is [[Tutorials/NoiseCovariance#The_case_of_MEG|recommended]] to derive the noise covariance from empty room recordings. However, as we do not have those recordings in the dataset, we can compute the noise covariance from the MEG signals before the trials. See the [[Tutorials/NoiseCovariance|noise covariance tutorial]] for more details. * In the raw '''SubjectCMC_clean_notch_high_abs''', right-click the '''Raw | clean | notch(...''' node and select '''''Noise covariance > Compute from recordings'''''. As parameters select: * '''Baseline''' from `18 - 30 s` * Select the '''Block by block''' option. . {{attachment:pro_noise_cov.png||width="60%"}} * Lastly, copy the '''Noise covariance''' node to the '''SubjectCMC_clean_notch_high_abs''' folder with the head model. This can be done with the shortcuts `Ctrl-C` and `Ctrl-V`. . {{attachment:tre_covmat.png||width="40%"}} |
| Line 280: | Line 375: |
| With the help of the '''head model''' and the '''noise covariance''', we can solve the '''inverse problem''' by computing an '''inverse kernel''' that will estimate the brain activity that gives origin to the observed recordings in the sensors. See the [[Tutorials/SourceEstimation|source estimation tutorial]] for more details. * To compute the inversion kernel, right click in the '''Overlapping spheres''' head model and select '''Compute sources [2018]'''. With the parameters: '''Minimum norm imaging''', '''dSPM''' and '''Constrained'''. |
Noe that the '''head model(s)''' and '''noise covariance''' have been computed, we can use the [[Tutorials/SourceEstimation#Method|minimum norm imaging]] method to solve the '''inverse problem'''. The result is a linear '''inversion kernel''', that estimates the source brain activity that gives origin to the observed recordings in the sensors. Note that, an inversion kernel is obtained for each of the head models: '''surface''' and '''volume'''. See the [[Tutorials/SourceEstimation|source estimation tutorial]] for more details. ==== Cortex surface ==== * Compute the inversion kernel, right-click in the '''Overlapping spheres (surface)''' head model and select '''Compute sources [2018]'''. With the parameters: * '''Minimum norm imaging''' * '''Current density map''' * '''Unconstrained''' * '''Comment''' = `MN: MEG surface` |
| Line 289: | Line 389: |
=== Scouts === To gather sources, surface and volume scouts ==== Surface scouts ==== See the units We need to add the Surface scouts. Open a source file, then the tab Scout. then the menu '''''Atlas > From subject anatomy > AAL3 (MNI-linear)''''' ==== Volume scouts ==== See the units We need to add the Surface scouts. Open a source file, then the tab Scout. then the menu '''''Atlas > From subject anatomy > AAL3 (MNI-linear)''''' |
|
| Line 296: | Line 405: |
| * Double-clik the source link for any of the trials to visualize the source space. This will enable the tab '''Scout''' in the main Brainstorm window. | * Double-click the source link for any of the trials to visualize the source space. This will enable the tab '''Scout''' in the main Brainstorm window. |
| Line 306: | Line 415: |
| * Change to the '''Process2''' tab, and drag-and-drop the '''Left (192 files)''' trial group into the '''Files A''' and into the '''Files B''' boxes. And select '''Process recordings''' for Files A, and '''Process sources''' for Files B. |
* Change to the '''Process2''' tab, and drag-and-drop the '''Left (192 files)''' trial group into the '''Files A''' and into the '''Files B''' boxes. And select '''Process recordings''' for Files A, and '''Process sources''' for Files B. |
| Line 323: | Line 430: |
| * To verify the location of the scouts on the cortex surface, double-click the source link for any of the trials. In the '''Surface''' tab, set the '''Amplitude''' threshold to `100%` to hide all the cortical activations. Lasly, in the '''Scouts''' tab, select the '''Show only the selected scouts''' and the '''Show/hide the scout labels'''. Note that the plots are linked by the scout selected in the '''image''' representation of the coherence results. This will enable the tab '''Scout''' in the main Brainstorm window. === Results with CAT12 MRI segmentation === |
* To verify the location of the scouts on the cortex surface, double-click the source link for any of the trials. In the '''Surface''' tab, set the '''Amplitude''' threshold to `100%` to hide all the cortical activations. Laslty, in the '''Scouts''' tab, select the '''Show only the selected scouts''' and the '''Show/hide the scout labels'''. Note that the plots are linked by the scout selected in the '''image''' representation of the coherence results. . {{attachment:res_coh_ab_ft.png||width="100%"}} === Results with FieldTrip MRI segmentation === {{{#!wiki warning '''[TO DISCUSS among authors]''' Same as the previous section but using the surface from CAT, and using DK atlas. {{attachment:res_coh_ab_cat.png||width="100%"}} }}} {{{#!wiki warning '''[TO DISCUSS among authors]''' In addition I barely ran the Coherence (as it took up to 30GB) for all the vertices vs EMG Left for the source estimation using the FielfTrip and the CAT12 segmentations Comparison for 14.65 Hz {{attachment:ft_vs_cat.png||width="100%"}} Sweeping from 0 to 80 Hz {{attachment:ft_vs_cat.gif||width="80%"}} }}} <<TAG(Advanced)>> |
| Line 331: | Line 453: |
| This should be label as advanced. |
{{{#!wiki warning '''[TO DO]''' Once we agree on all the steps above. }}} |
| Line 343: | Line 466: |
| * ''Tutorial: [[Tutorials/Connectivity|Functional connectivity]] '' | |
| Line 345: | Line 469: |
| * ''Forum: Minimum norm units (pA.m): [[http://neuroimage.usc.edu/forums/showthread.php?1246-Doubt-about-current-density-units-pA.m-or-pA-m2|http://neuroimage.usc.edu/forums/showthread.php?1246]] '' |
{{{#!wiki warning '''[TO DO]''' Find relevant Forum posts. }}} |
MEG corticomuscular coherence
[TUTORIAL UNDER DEVELOPMENT: NOT READY FOR PUBLIC USE]
Authors: Raymundo Cassani
Corticomuscular coherence relates to the synchrony between electrophysiological signals (MEG, EEG or ECoG) recorded from the contralateral motor cortex, and EMG signal from a muscle during voluntary movement. This synchrony has its origin mainly in the descending communication in corticospinal pathways between primary motor cortex (M1) and muscles. This tutorial replicates the processing pipeline and analysis presented in the Analysis of corticomuscular coherence FieldTrip tutorial.
Contents
Background
Coherence is a classic method to measure the linear relationship between two signals in the frequency domain. Previous studies (Conway et al., 1995, Kilner et al., 2000) have used coherence to study the relationship between MEG signals from M1 and muscles, and they have shown synchronized activity in the 15–30 Hz range during maintained voluntary contractions.
IMAGE OF EXPERIMENT, SIGNALS and COHERENCE
Dataset description
The dataset is comprised of MEG (151-channel CTF MEG system) and bipolar EMG (from left and right extensor carpi radialis longus muscles) recordings from one subject during an experiment in which the subject had to lift her hand and exert a constant force against a lever. The force was monitored by strain gauges on the lever. The subject performed two blocks of 25 trials in which either the left or the right wrist was extended for about 10 seconds. In addition to the MEG and EMG signals, EOG signal was recorded to assist the removal of ocular artifacts. Only data for the left wrist will be analyzed in this tutorial.
Download and installation
Requirements: You should have already followed all the get-started tutorials and you have a working copy of Brainstorm installed on your computer.
Download the dataset:
Download the SubjectCMC.zip file from FieldTrip FTP server:
ftp://ftp.fieldtriptoolbox.org/pub/fieldtrip/tutorial/SubjectCMC.zip- Unzip it in a folder that is not in any of the Brainstorm folders (program or database folder).
Brainstorm:
- Start Brainstorm (Matlab scripts or stand-alone version).
Select the menu File > Create new protocol. Name it TutorialCMC and select the options:
No, use individual anatomy,
No, use one channel file per acquisition run.
The next sections describe: importing the subject's anatomy, reviewing raw data, managing event markers, pre-processing the EMG and MEG signals, epoching and importing recordings, and computing coherence in the sensor and source level.
Importing anatomy data
Right-click on the TutorialCMC node then New subject > Subject01.
Keep the default options you defined for the protocol.Switch to the Anatomy view of the protocol.
Right-click on the Subject01 node then Import MRI:
Set the file format: All MRI file (subject space)
Select the file: SubjectCMC/SubjectCMC.mri
Compute MNI normalization, in the MRI viewer click on Click here to compute MNI normalization, use the maff8 method. When the normalization is complete, verify the correct location of the fiducials and click on Save.
Once the MRI has been imported and normalized, we need to segment the head and brain tissues to obtain the surfaces that are needed to generate a realistic head model (or forward model).
Right-click on the SubjectCMC MRI node, then MRI segmentation > FieldTrip: Tissues, BEM surfaces.
Select all the tissues (scalp, skull, csf, gray and white).
Click OK.
For the option Generate surface meshes select No.
After the segmentation is complete, a tissues node will be shown in the tree.
Rick-click on the tissues node and select Generate triangular meshes
- Select the 5 layers to mesh
- Use the default parameters:
number of vertices: 10,000
erode factor: 0
fill holes factor: 2
As output, there is a set of (head and brain) surface files that will be used for the head model computation.
By displaying the surfaces, we can note that the cortex, which is related to the gray matter (shown in red) overlaps heavily with the innerskull surface (shown in gray), so it cannot be used to compute a BEM forward model using OpenMEEG. However, as we are dealing with MEG signals, we can still compute the forward model with the overlapping-spheres method, and obtain similar results. We can also notice that the cortex and white surfaces obtained with the method above do not register accurately the cortical surface, they can be used for volume-based source estimation, which is based on a volume grid of source points; but they may not be used for surface-based source estimation. Better surfaces can be obtained by doing MRI segmentation with CAT12 or FreeSurfer.
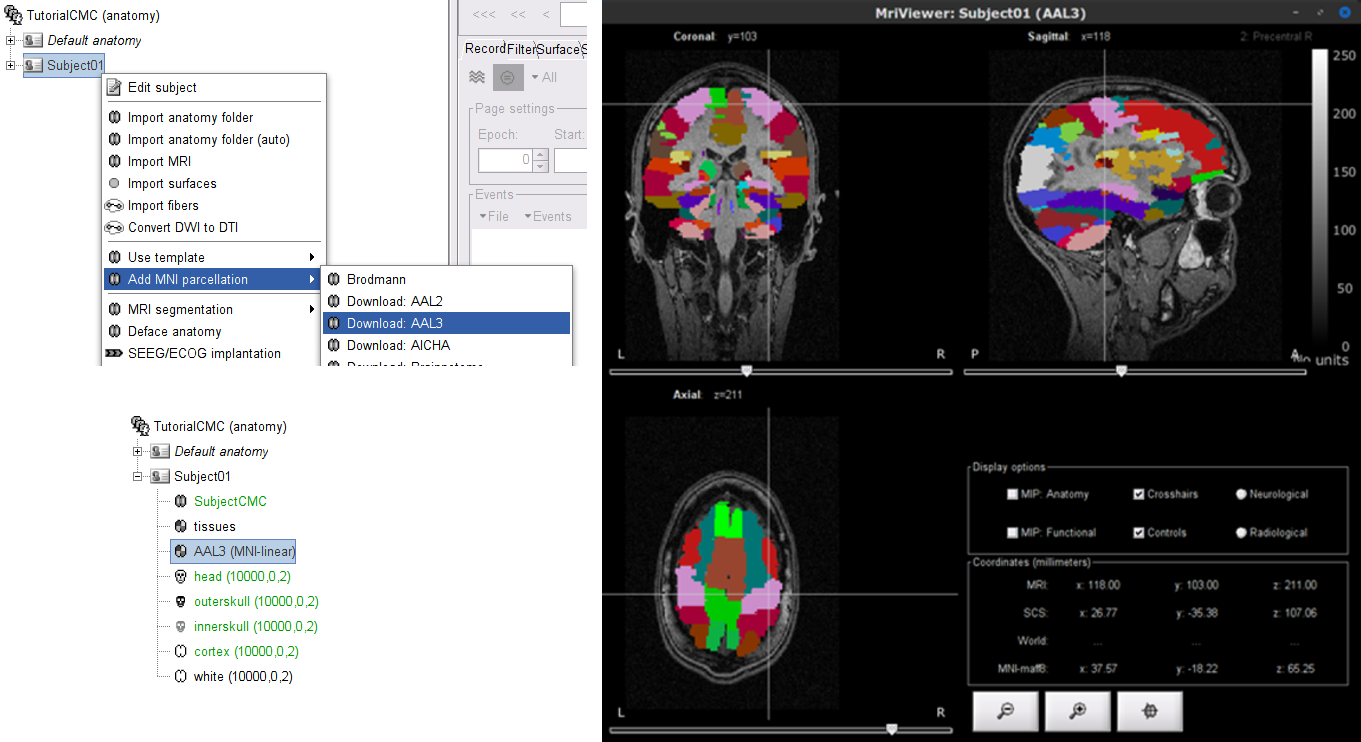
As the imported anatomy data is normalized in the MNI space, it is possible to apply use MNI parcellation templates to define anatomical regions of the brain of the subject. These anatomical regions can be used to create volume and surface scouts, which are convenient when performing the coherence analysis in the source level. Let's add the AAL3 parcellation to the imported data.
Right-click on Subject01 then go to the menu Add MNI parcellation > AAL3. The menu will appear as Download: AAL3 if the atlas is not in your system. Once the MNI atlas is downloaded, an atlas node (ICON) appears in the database explorer and the atlas is displayed in the the MRI viewer.
Access the recordings
Link the recordings
Switch to the Functional data view (X button).
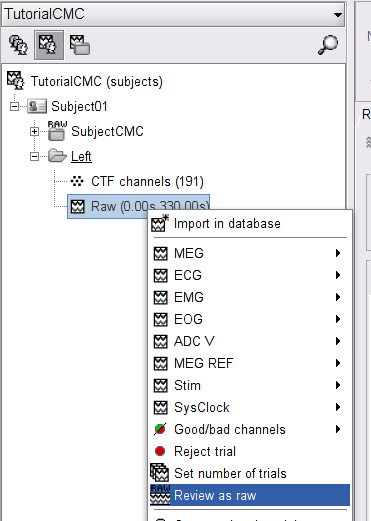
Right-click on the Subject01 node then Review raw file:
Select the file format: MEG/EEG: CTF(*.ds; *.meg4; *.res4)
Select the file: SubjectCMC.ds
A new folder and its content are now visible in the database explorer:
The SubjectCMC folder represents the MEG dataset linked to the database. Note the tag "RAW" in the icon of the folder, this means that the files are considered as raw continuous files.
The CTF channels (191) node is the channel file and defines the types and names of channels that were recorded, the position of the sensors, the head shape and other various details. This information has been read from the MEG datasets and saved as a new file in the database. The total number of data channels recorded in the file is indicated between parenthesis (191).
The Link to raw file node is a link to the original file that was selected. All the relevant metadata was read from the MEG dataset and copied inside the link itself (sampling rate, number of samples, event markers and other details about the acquisition session). As it is a link, no MEG recordings were copied to the database. When we open this file, the values are read directly from the original files in the .ds folder. More information.
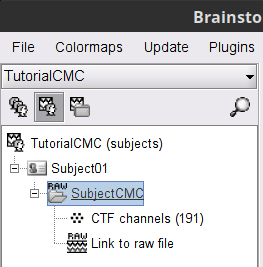
Display MEG helmet and sensors
Right-click on the CTF channels (191) node, then Display sensors > CTF helmet and Display sensors > MEG to show a surface that represents the inner surface the helmet, and the MEG sensors respectively. Try additional display menus.
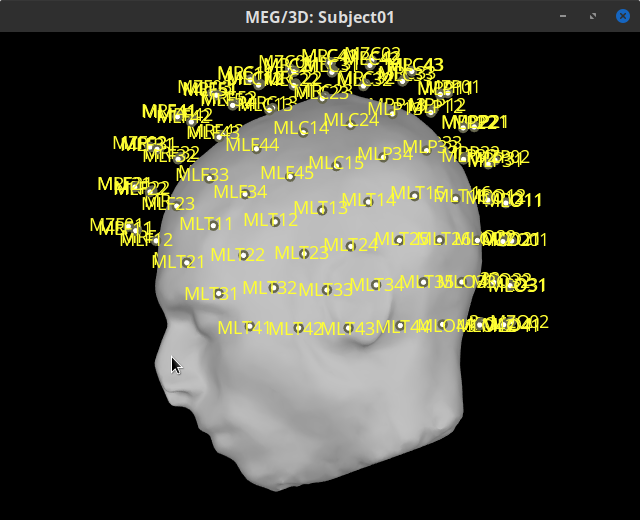
Reviewing continuous recordings
Right-click on the Link to raw file node, then Switch epoched/continuous to convert the file to continuous.
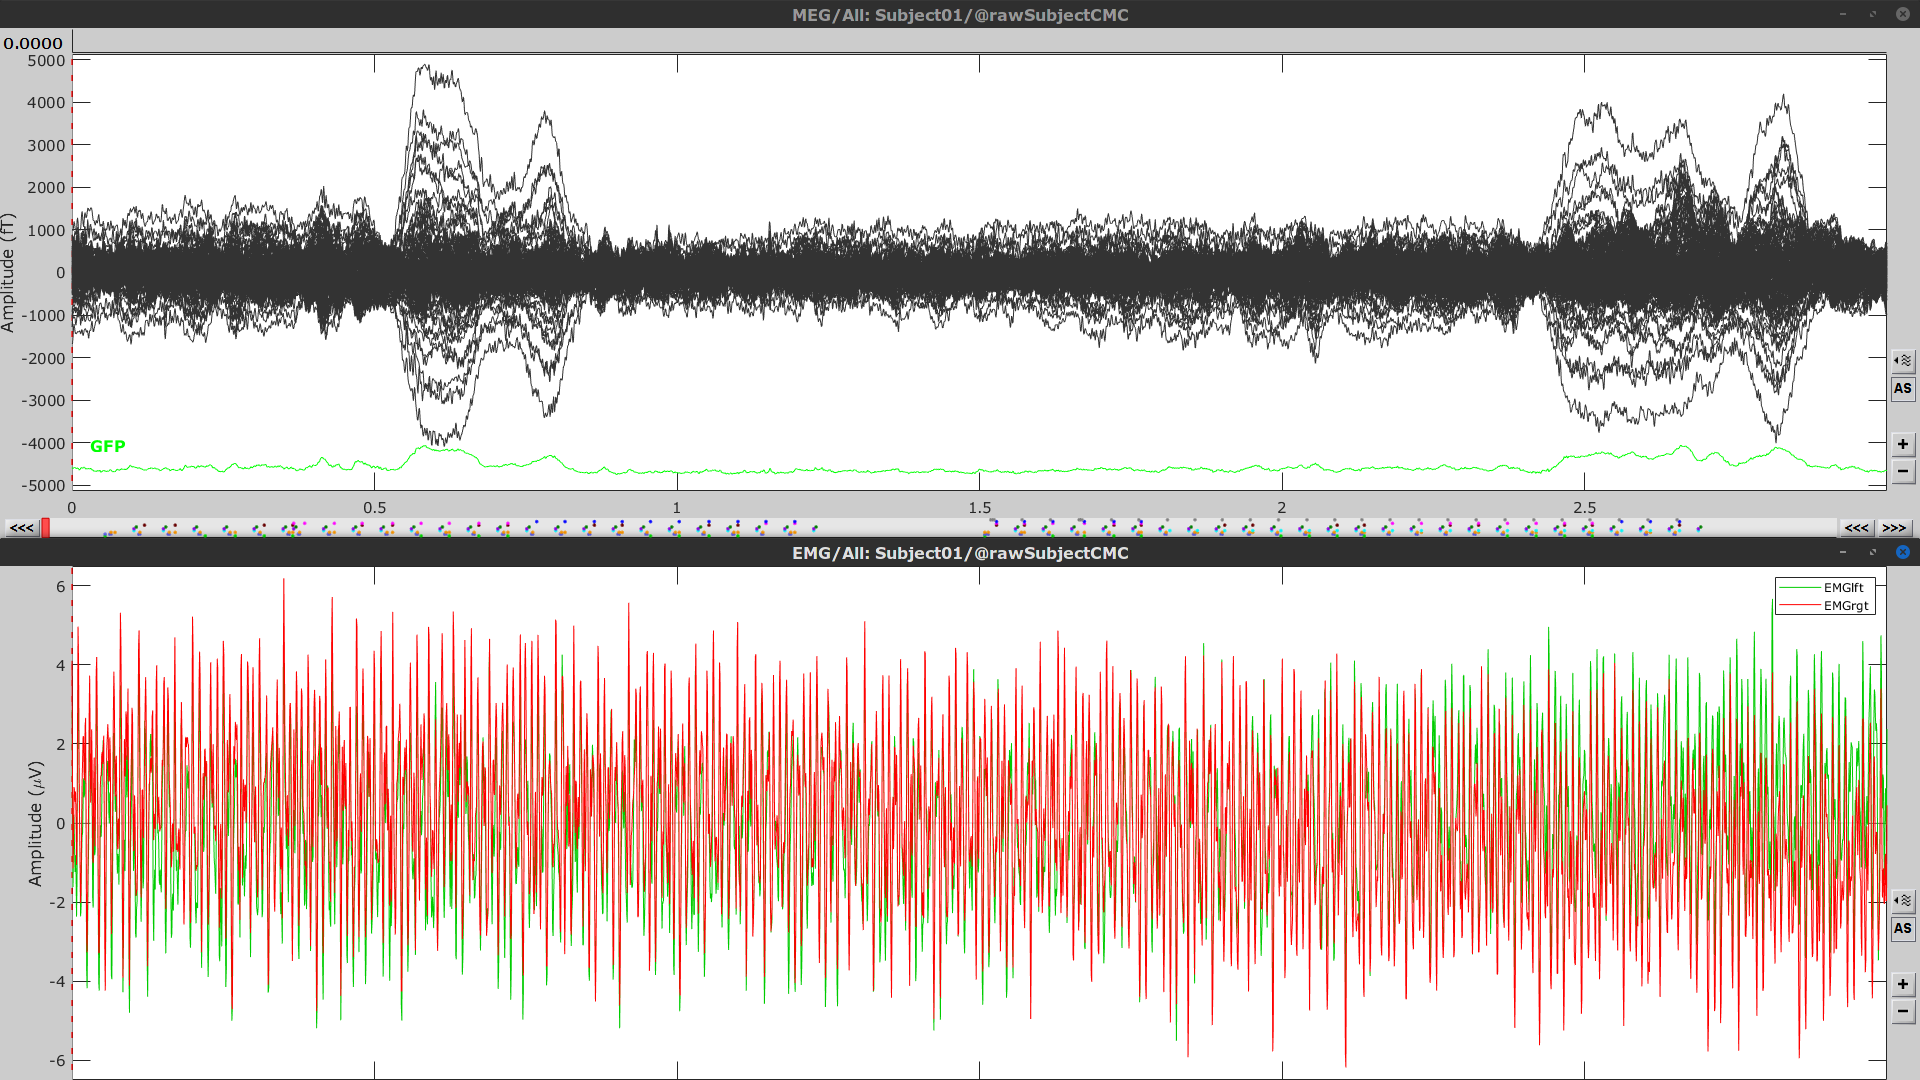
Right-click on the Link to raw file node, then MEG > Display time series (or double-click on the node). This opens a new time series figure and enable the Time panel and the Record tab in the main Brainstorm window. Controls in this panel and tab are used to explore the time series.
In addition we can display the EMG signals, right-click on the Link to raw file node, then EMG > Display time series.
Event markers
The colored dots on top of the recordings in the time series figures represent the event markers (or triggers) saved in this dataset. In addition to these events, the start of the either left or right trials is saved in the auxiliary channel named Stim. To add these markers:
With the time series figure open, in the Record tab go to File > Read events from channel. Now, in the options for the Read from channel process, set Event channels = Stim, select Value, and click Run.
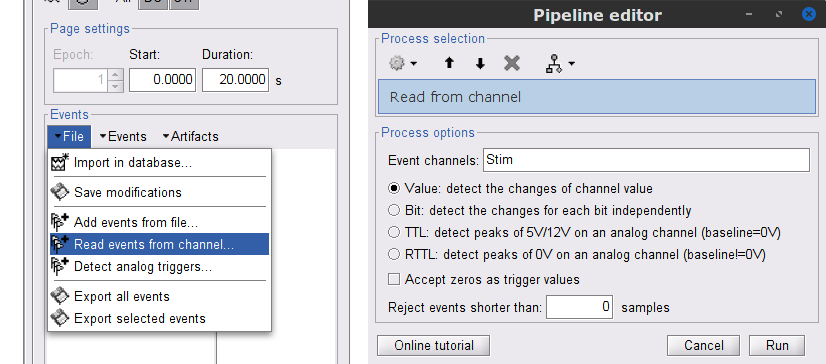
This creates new events shown in the Events section of the tab. We are only interested in the events from U1 to U25 that correspond to the 25 left trials. Thus we will delete the other events, and merge the left trial events.
Delete all the other events: select the events to delete with Ctrl+click, when done go the menu Events > Delete group and confirm. Alternatively, you can do Ctrl+A to select all the events and then deselect the U1 to U25 events.
To be in line with the original FieldTrip tutorial, we will reject the trial 7. Select the events U1 to U6 and U8 to U25 events, then go the menu Events > Merge group and enter the label Left.
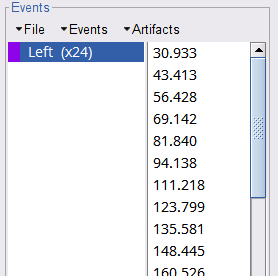
These events are located at the beginning of the 10 s trials of left wrist movement. In the sections below, we will compute the coherence for 1 s epochs for the first 8 s of the trial, thus we need to create extra events.
Duplicate 7 times the Left events by selecting Duplicate group in the Events menu. The groups Left_02 to Left_08 will be created.
For each copy of the Left events, we need to add a time offset of 1 s for Left02, 2 s for Left03, and so on. Select the event group to add the offset, then go to the menu Events > Delete group.
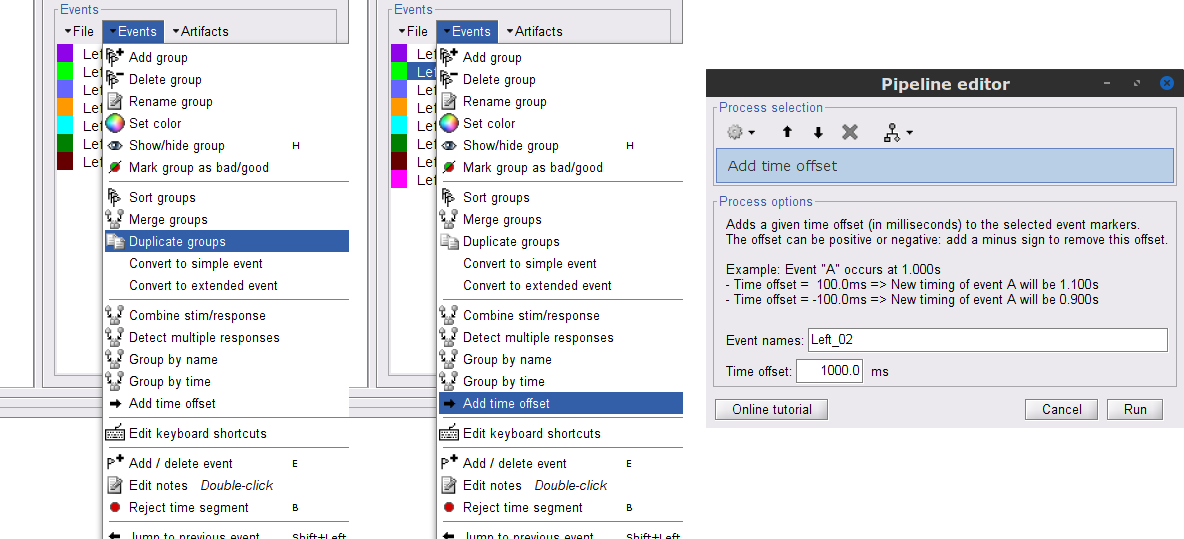
Finally, merge all the Left* events into Left, and select Save modifications in the File menu in the Record tab.
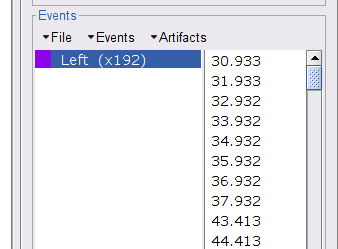
Pre-process
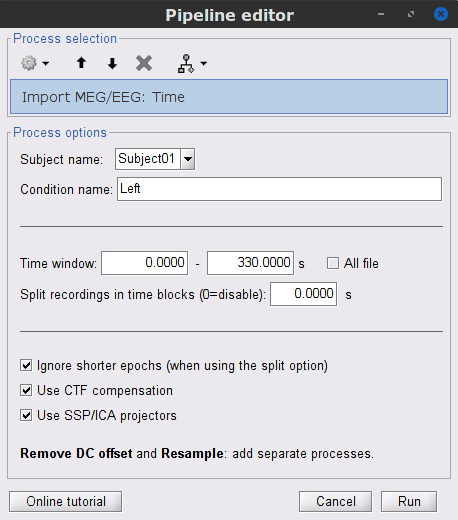
In this tutorial will be analyzing only the Left trials. As such, in the following sections we will process only the first 330 s of the recordings.
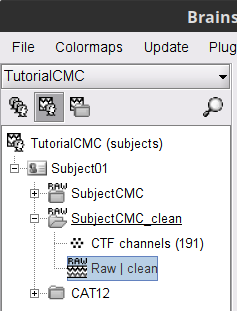
The CTF MEG recordings in this dataset were not saved with the desired 3rd order compensation. To continue with the pre-processing we need to apply the compensation.
In the Process1 box: Drag and drop the Link to raw file node.
Run process Artifacts > Apply SSP & CTF compensation:
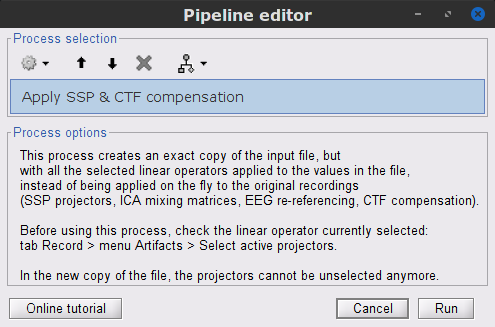
This process create the SubjectCMC_clean folder that contains a copy of the channel file and the raw recordings file Raw | clean, which is de exact copy of the original data but with the CTF compensation applied.
Power line artifacts
Let's start with locating the spectral components and impact of the power line noise in the MEG and EMG signals.
In the Process1 box: Drag and drop the Raw | clean node.
Run process Frequency > Power spectrum density (Welch):
Time window: 0 - 330 s
Window length=10 s
Overlap=50%
Sensor types=`MEG, EMG
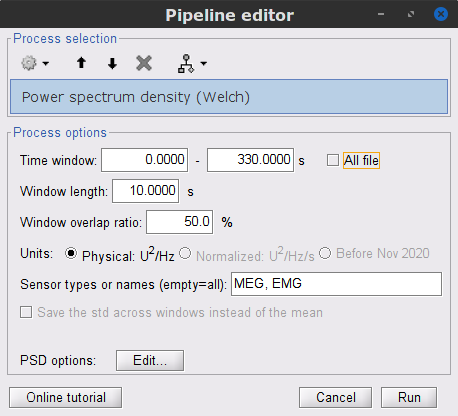
Double-click on the new PSD file to display it.
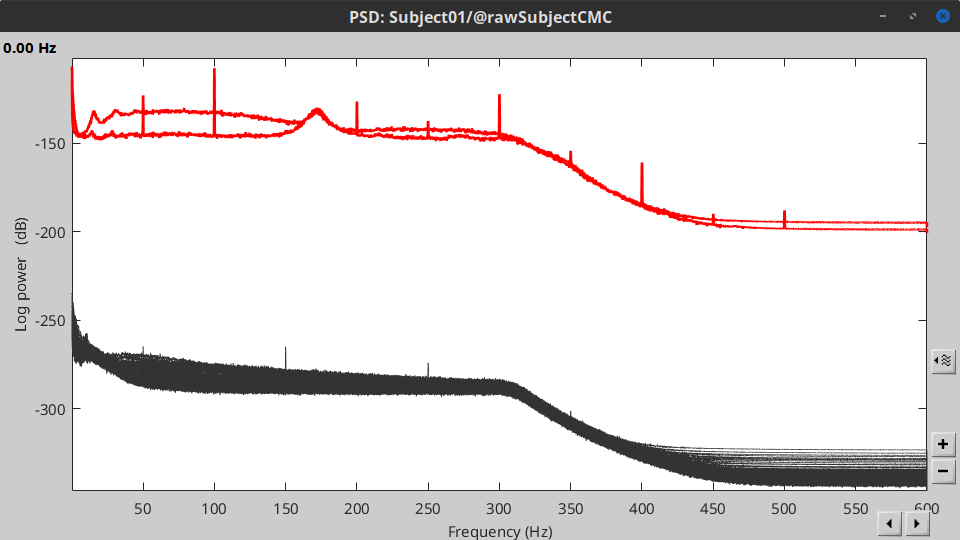
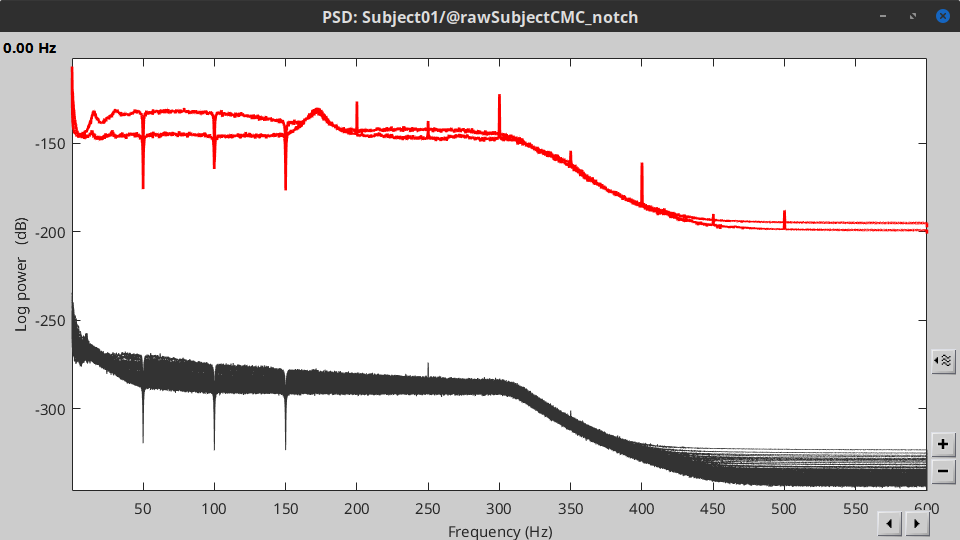
- The PSD shows two groups of sensors, EMG on top and MEG in the bottom. Also, there are peaks at 50Hz and its harmonics. We will use notch filters to remove the power line component and its first two components from the signals.
Run the process Pre-processing > Notch filter with:
Sensor types = MEG, EMG
Frequencies to remove (Hz) = 50, 100, 150
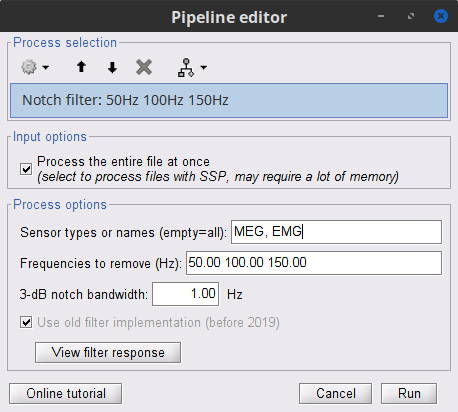
A new raw folder named SubjectCMC_clean_notch will appear in the database explorer. Compute the PSD for the filtered signals to verify effect of the notch filters. Remember to compute for the Time window from 0 to 330 s.
Pre-process EMG
Two of the typical pre-processing steps for EMG consist in high-pass filtering and rectifying.
In the Process1 box: drag and drop the Raw | notch(50Hz 100Hz 150Hz) recordings node.
Add the process Pre-process > Band-pass filter
Sensor types = EMG
Lower cutoff frequency = 10 Hz
Upper cutoff frequency = 0 Hz
Add the process Pre-process > Absolute values
Sensor types = EMG
- Run the pipeline
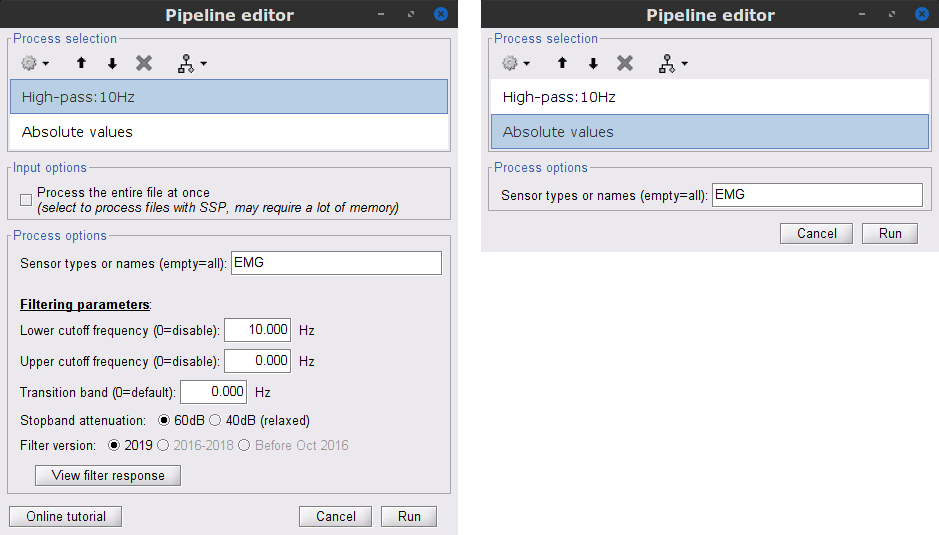
Once the pipeline ends, the new folders SubjectCMC_clean_notch_high and SubjectCMC_clean_notch_high_abs are added to the database explorer. To avoid any confusion later, we can delete folders that will not be needed.
Delete the conditions SubjectCMC_clean_notch and SubjectCMC_clean_notch_high. Select both folders containing and press Delete (or right-click File > Delete).
Pre-process MEG
After applying the notch filter to the MEG signals, we still need to remove other type of artifacts, we will perform:
Detection and removal of artifacts with SSP
Detection of segments with other artifacts
Detection and removal of artifacts with SSP
In the case of stereotypical artifacts, as it is the case of the eye blinks and heartbeats, it is possible to identify their characteristic spatial distribtuion, and then remove it from MEG signals with methods such as Signal-Space Projection (SSP). For more details, consult the tutorials on detection and removal of artifacts with SSP. The dataset of this tutorial contains an EOG channel but not ECG signal, thus will perform only removal of eye blinks.
Display the MEG and EOG time series. Right-click on the pre-processed (for EMG) continuous file Raw | clean | notch(... (in the SubjectCMC_clean_notch_high_abs folder) then MEG > Display time series and EOG > Display time series.
In the Events section of the Record tab, select Artifacts > Detect eye blinks, and use the parameters:
Channel name= EOG
Time window = 0 - 330 s
Event name = blink
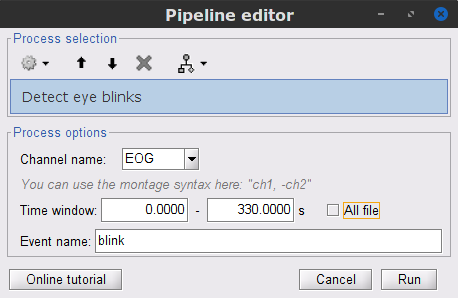
As result, there will be 3 blink event groups. Review the traces of EOG channels and the blink events to be sure the detected events make sense. Note that the blink group contains the real blinks, and blink2 and blink3 contain mostly saccades.
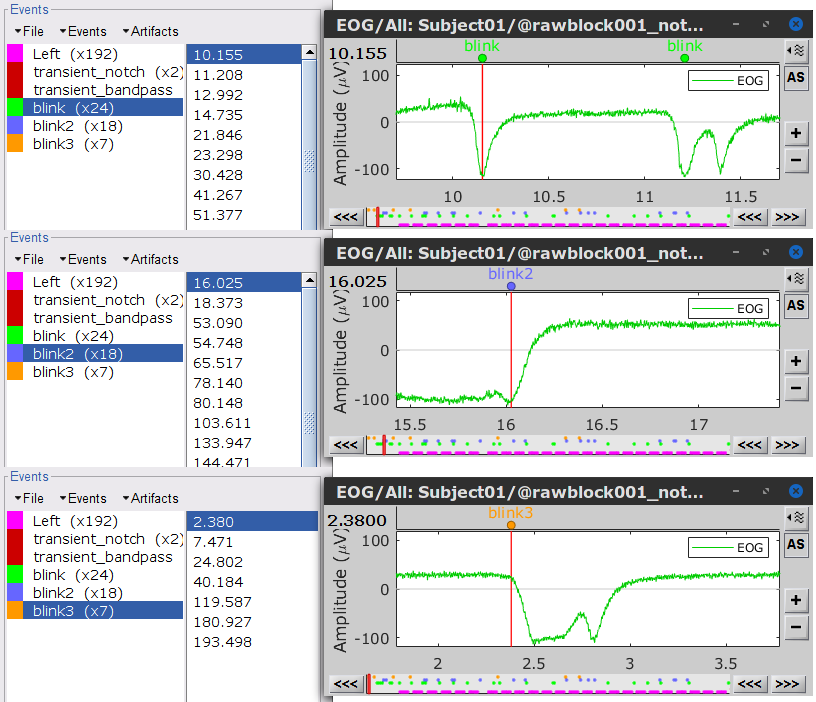
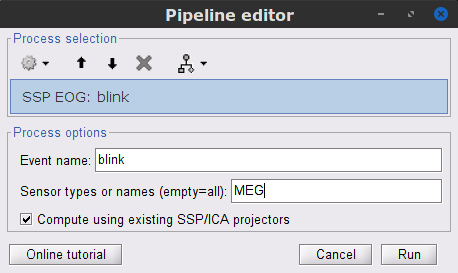
To remove blink artifacts with SSP go to Artifacts > SSP: Eyeblinks, and use the parameters:
Event name=blink
Sensors=MEG
Check Compute using existing SSP/ICA projectors
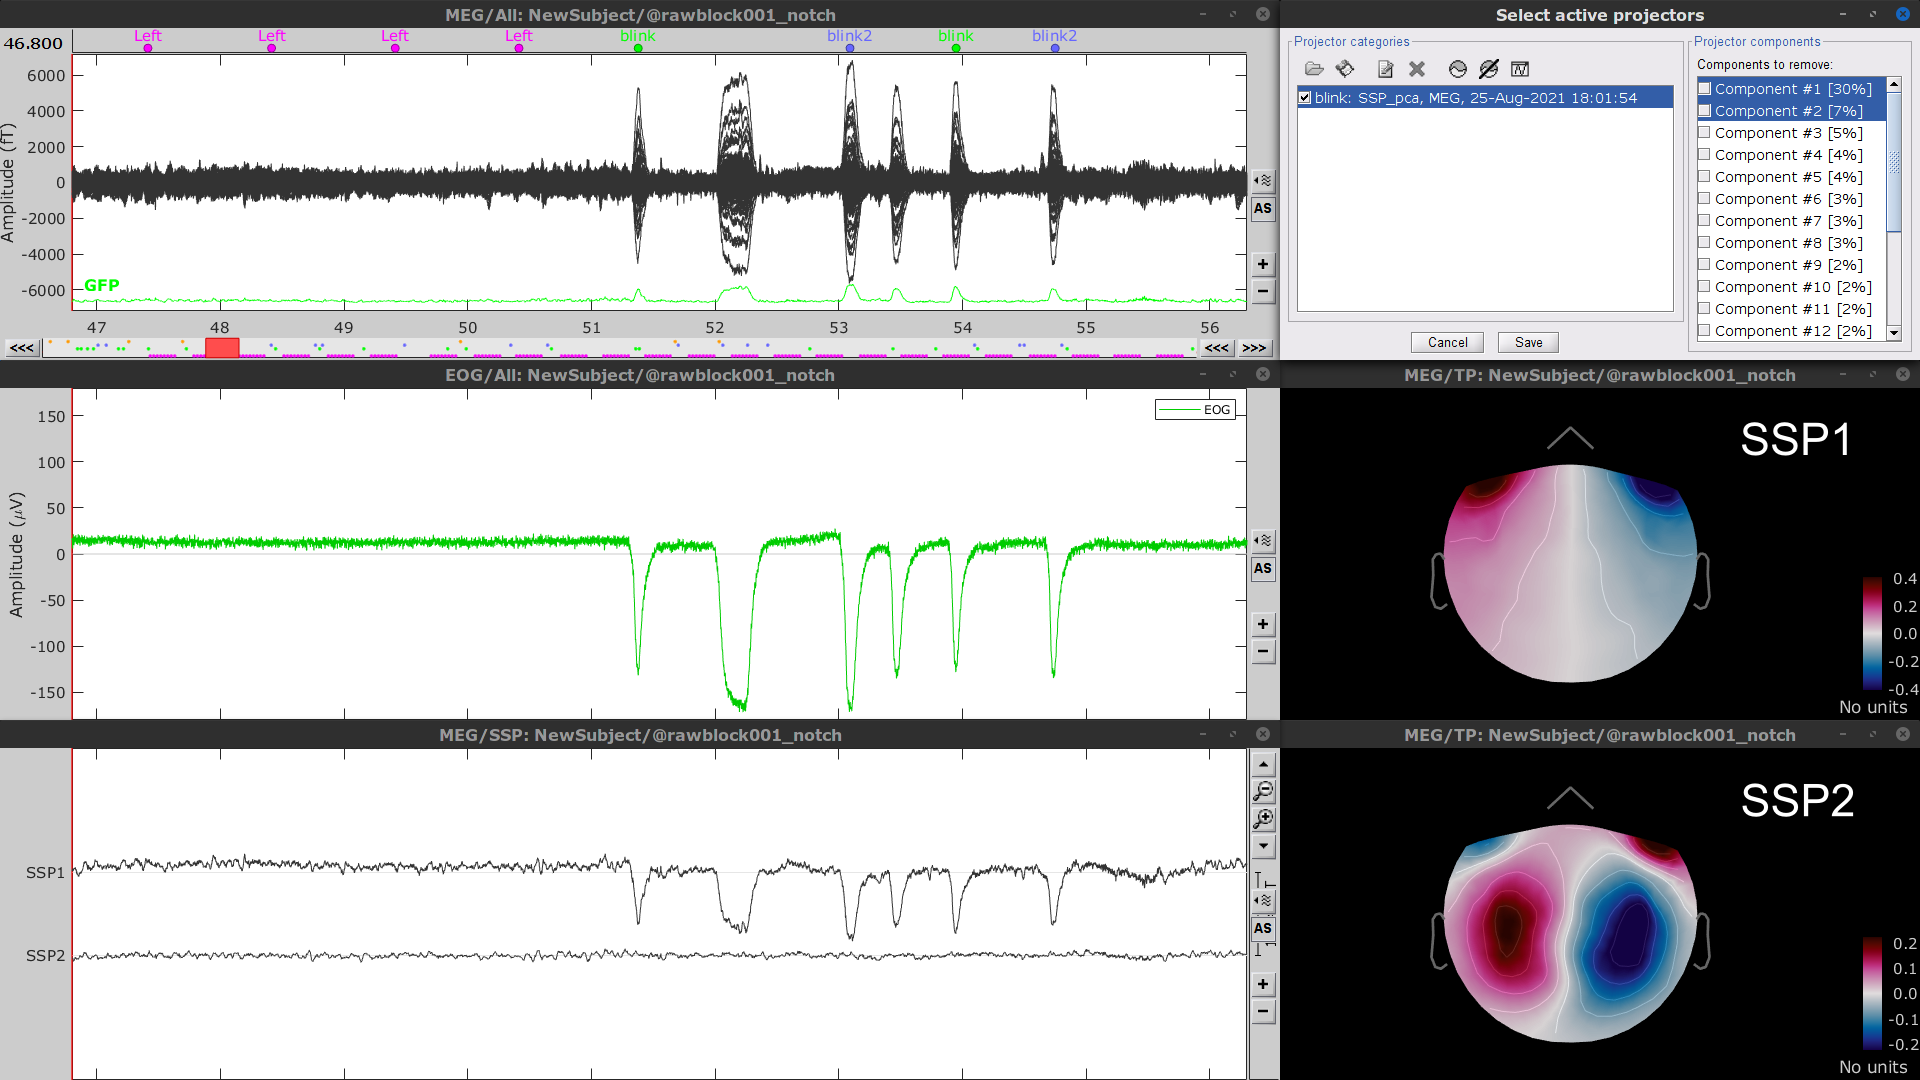
- Display the time series and topographies for the first two components. Only the first one is clearly related to blink artifacts. Select only component #1 for removal.
Follow the same procedure for the other blink events (blink2 and blink3). Note that none of first two components for the remaining blink events is clearly related to a ocular artifacts. This figure shows the first two components for the blink2 group.
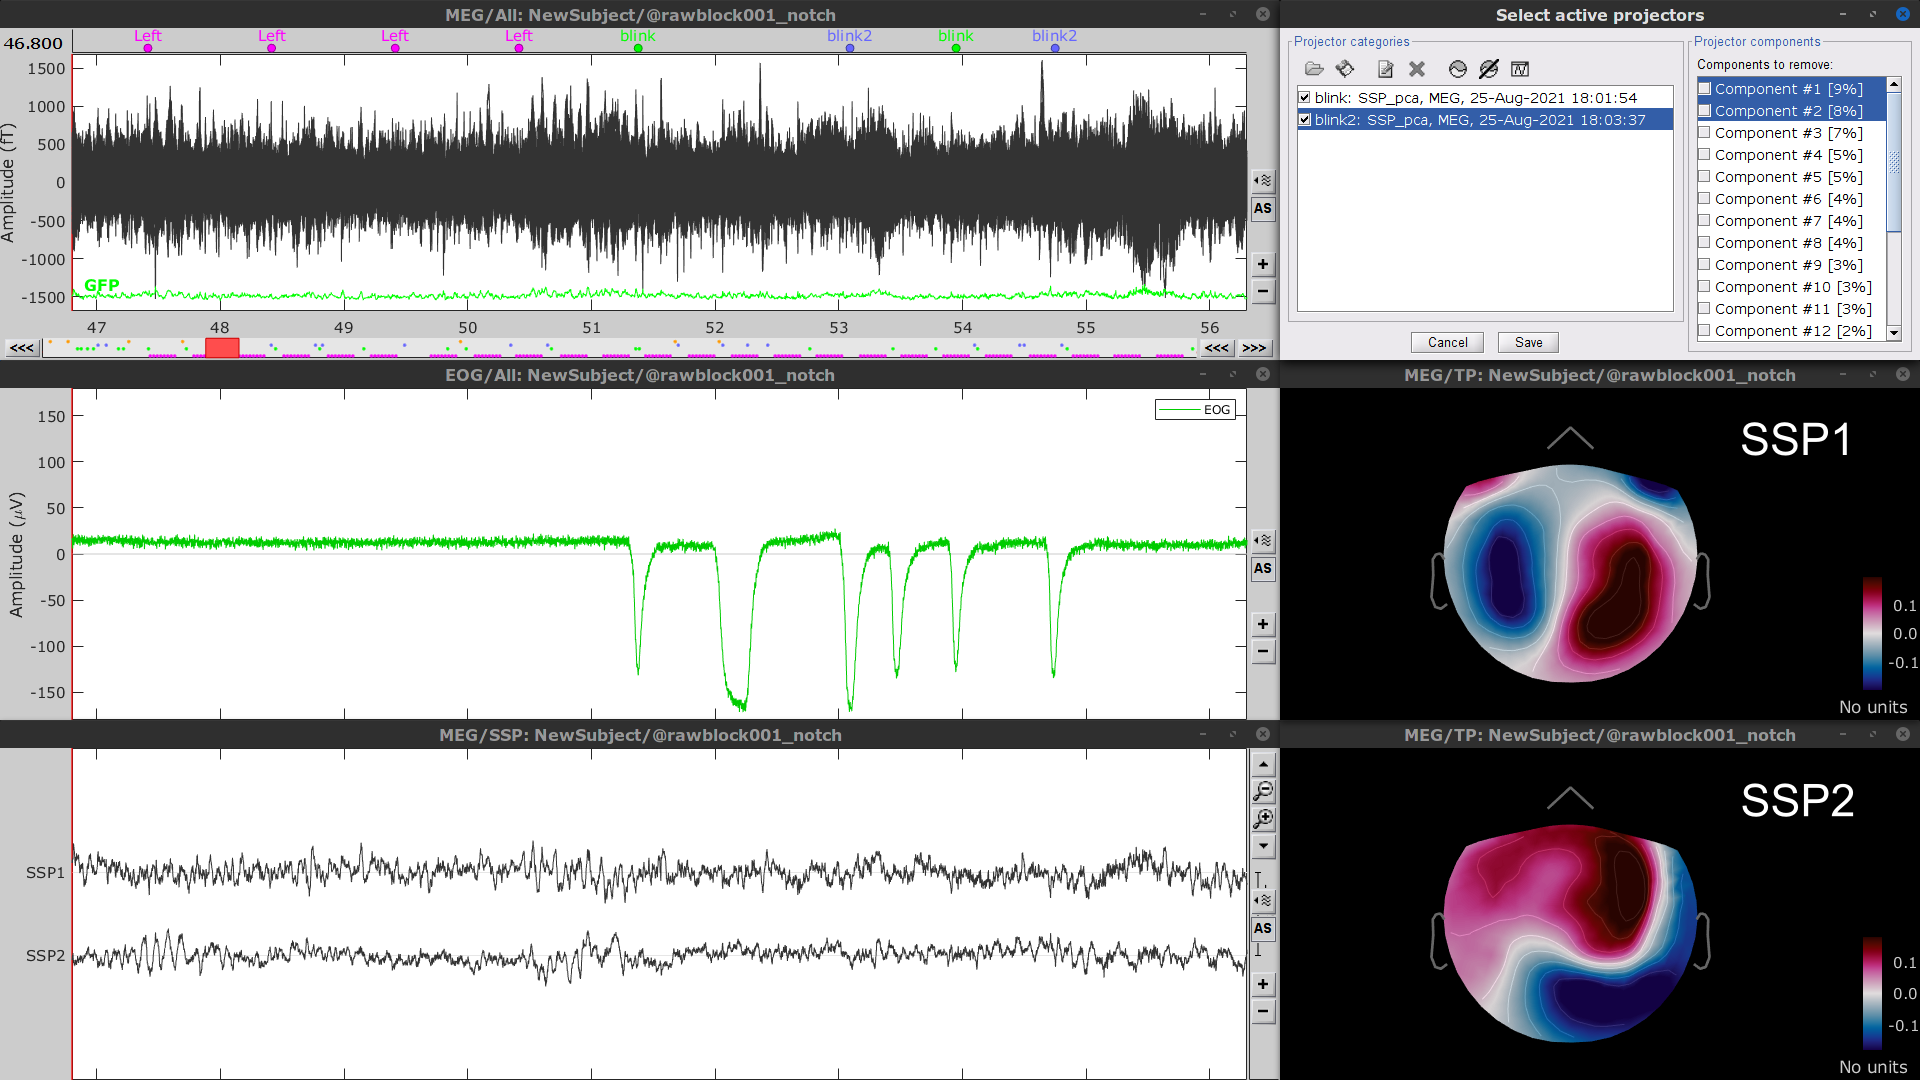
In this case, it is safer to unselect the blink2 and blink3 groups, rather than removing spatial components that we are not sure to identify.
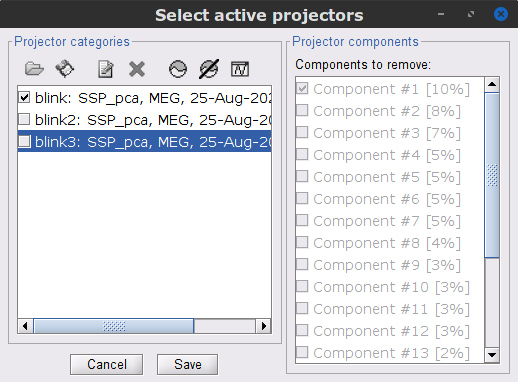
- Close all the figures
Detection of segments with other artifacts
Here we will used automatic detection of artifacts. It aims to identify typical artifacts such as the ones related to eye movements, subject movement and muscle contractions.
Display the MEG and EOG time series. In the Record tab, select Artifacts > Detect other artifacts, use the following parameters:
Time window = 0 - 330 s
Sensor types=MEG
Sensitivity=3
Check both frequency bands 1-7 Hz and 40-240 Hz
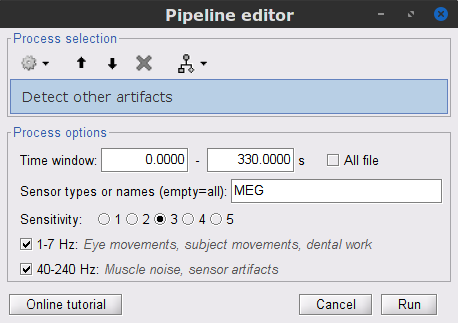
While this process can help identify segments with artifacts in the signals, it is still advised to review the selected segments. After a quick browse, it can be noticed that the selected segments indeed correspond to irregularities in the MEG signal. Then, we will label these events are bad.
Select the 1-7Hz and 40-240Hz event groups and use the menu Events > Mark group as bad. Alternatively, you can rename the events and add the tag bad_ in their name, it would have the same effect.
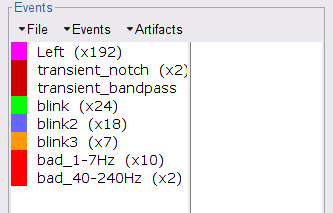
- Close all the figures, and save the modifications.
Importing the recordings
At this point we have finished with the pre-processing of our EMG and MEG recordings. Many operations operations can only be applied to short segments of recordings that have been imported in the database. We refer to these as epochs or trials. Thus, the next step is to import the data taking into account the Left events.
Right-click on the filtered continuous file Raw | clean | notch(... (in the SubjectCMC_clean_notch_high_abs condition), then Import in database.
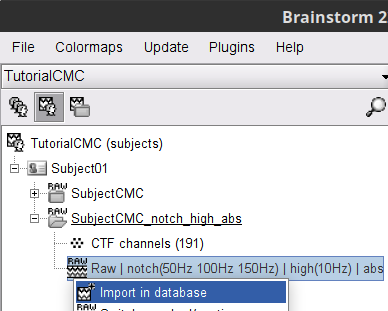
- Set the following parameters:
Time window = 0 - 330 s
Check Use events and highlight the Left(x192) event group
Epoch time = 0 - 1000 ms
Check Apply SSP/ICA projectors
Check Remove DC offset and select All recordings
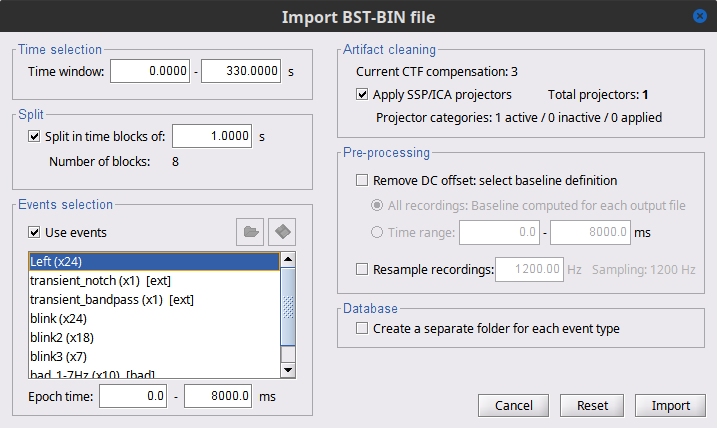
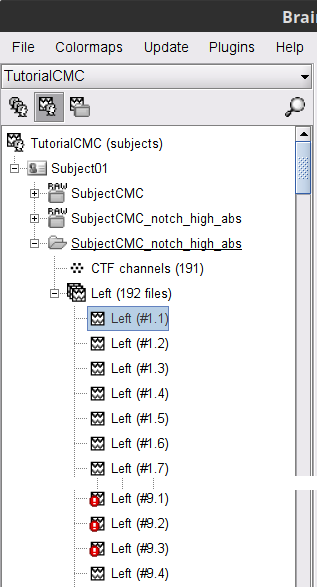
The new folder SubjectCMC_clean_notch_high_abs appears for Subject01. It contains a copy of the channel file in the continuous file, and the Left trial group. By expanding the trial group, we can notice that there are trials marked with an interrogation sign in a red circle (ICON). These bad trials are the ones that were overlapped with the bad segments identified in the previous section. All the bad trials are automatically ignored in the Process1 and Process2 tabs.
Coherence (sensor level)
Once we have imported the trials, we will compute the magnitude square coherence (MSC) between the left EMG signal and the signals from each of the MEG sensors.
In the Process1 box, drag and drop the Left (192 files) trial group. Note that the number between square brackets is [185], as the 7 bad trials are ignored.
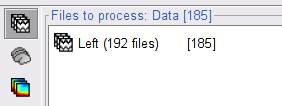
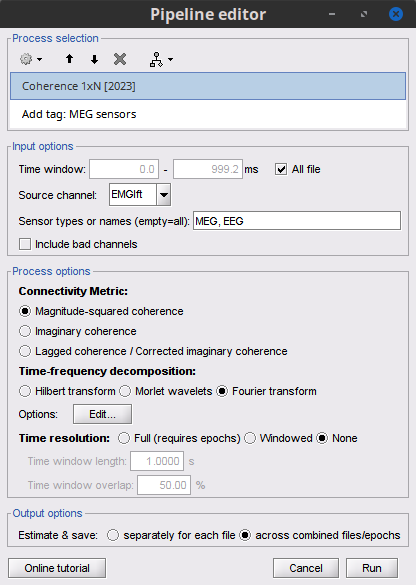
To compute the coherence between EMG and MEG signals. Run the process Connectivity > Coherence 1xN [2021] with the following parameters:
Time window = 0 - 1000 ms or check All file
Source channel = EMGlft
Do not check Include bad channels nor Remove evoke response
Magnitude squared coherence
Window length for PSD estimation = 0.5 s
Overlap for PSD estimation = 50%
Highest frequency of interest = 80 Hz
Average cross-spectra of input files (one output file)
More details on the Coherence process can be found in the ?connectivity tutorial.
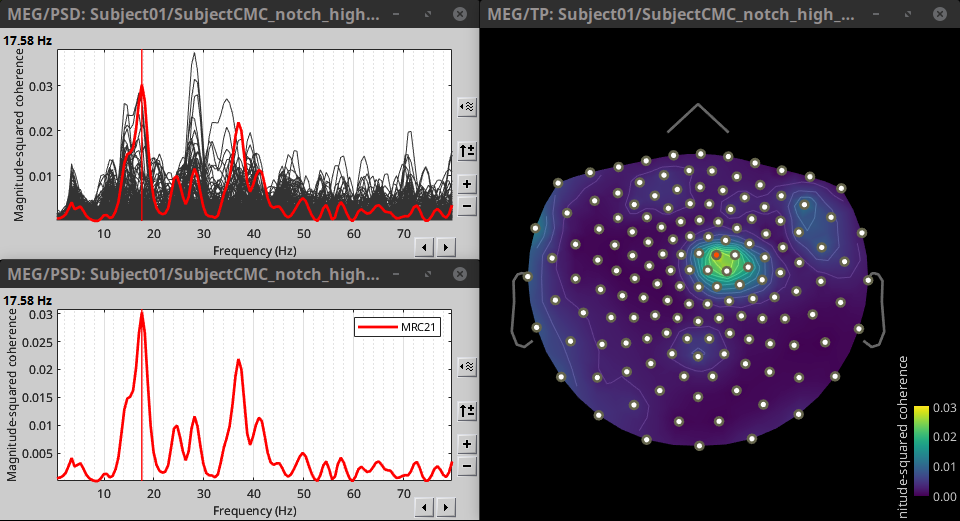
Double-click on the resulting node mscohere(0.6Hz,555win): EMGlft to display the MSC spectra. Click on the maximum peak in the 15 to 20 Hz range, and press Enter to plot it in a new figure. This spectrum corresponds to channel MRC21, and has its peak at 17.58 Hz. You can also use the frequency slider (below the Time panel) to explore the spectral representations.
* Right-click on the spectrum and select 2D Sensor cap for a spatial visualization of the coherence results, alternatively, the short cut Ctrl-T can be used. Once the 2D Sensor cap is show, the sensor locations can be displayed with right-click then Channels > Display sensors or the shortcut Ctrl-E.
The results above are based in the identification of single peak, as alternative we can average the MSC in a given frequency band (15 - 20 Hz), and observe its topographical distribution.
In the Process1 box, drag-and-drop the mscohere(0.6Hz,555win): EMGlft node, and add the process Frequency > Group in time or frequency bands with the parameters:
Select Group by frequency
Type cmc_band / 15, 20 / mean in the text box.
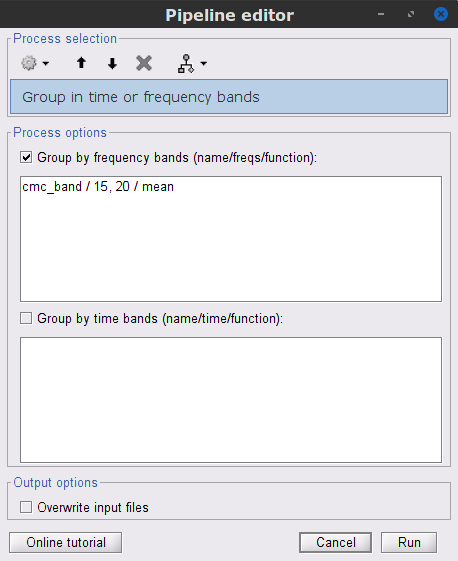
The resulting file mscohere(0.6Hz,555win): EMGlft | tfbands has only one MSC value for each sensor (the average in the 15-20 Hz band). Thus, it is more useful to display the result in a spatial representation. Brainstorm provides 3 spatial representations: 2D Sensor cap, 2D Sensor cap and 2D Disk, which are accessible with right-click on the MSC node. Sensor MRC21 is selected as reference.
In agreement with the literature, we observe higher MSC values between the EMG signal and the MEG signal for MEG sensors over the contralateral primary motor cortex in the beta band range. In the next sections we will perform source estimation and compute coherence in the source level.
Source analysis
In this tutorial we will perform source modelling using the distributed model approach for two sources spaces: cortex surface and MRI volume. In the first one the location of the sources is constrained to the cortical surface obtained when the subject anatomy was imported. For the second source space, the sources are uniformly distributed in the entire brain volume. Before estimating the brain sources, we need to compute head model and the noise covariance. Note that a head model is required for each source space.
Head model
The head model describes how neural electric currents produce magnetic fields and differences in electrical potentials at external sensors, given the different head tissues. This model is independent of sensor recordings. See the head model tutorial for more details. Each source space, requires its own head model.
Cortex surface
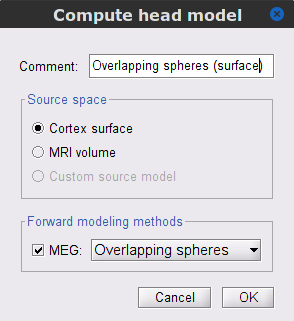
In the SubjectCMC_clean_notch_high_abs, right-click the CTF channels (191) node and select Compute head model. Keep the default options:
Comment = Overlapping spheres (surface)
Source space = Cortex surface
Forward model = Overlapping spheres.
Keep in mind that the number of sources (vertices) in this head model is 10,000, and was defined when when the subject anatomy was imported.
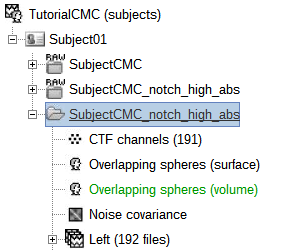
The (ICON) Overlapping spheres (surface) head model will appear in the database explorer.
MRI volume
In the SubjectCMC_clean_notch_high_abs, right-click the CTF channels (191) node and select Compute head model. Keep the default options:
Comment = Overlapping spheres (volume)
Source space = MRI volume
Forward model = Overlapping spheres.
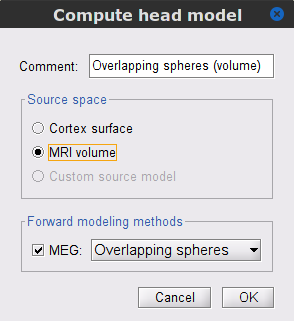
The Volume source grid window pop-up, to define the volume grid. Use the following parameters, that will lead to an estimated number of 12,200 grid points.
Select Regular grid and Brain
Grid resolution = 5 mm
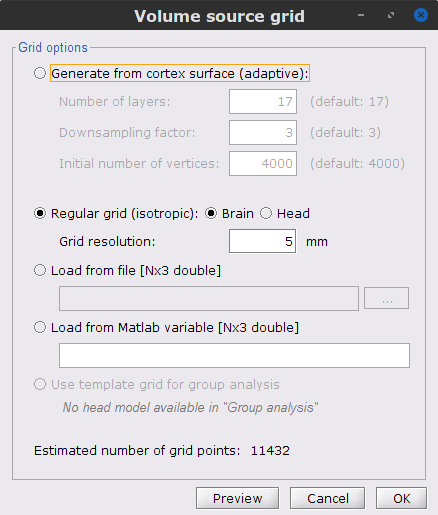
The Overlapping spheres (volume) node will be added to the database explorer. The green color indicates the default head model for the folder.
Noise covariance
For MEG recordings it is recommended to derive the noise covariance from empty room recordings. However, as we do not have those recordings in the dataset, we can compute the noise covariance from the MEG signals before the trials. See the noise covariance tutorial for more details.
In the raw SubjectCMC_clean_notch_high_abs, right-click the Raw | clean | notch(... node and select Noise covariance > Compute from recordings. As parameters select:
Baseline from 18 - 30 s
Select the Block by block option.
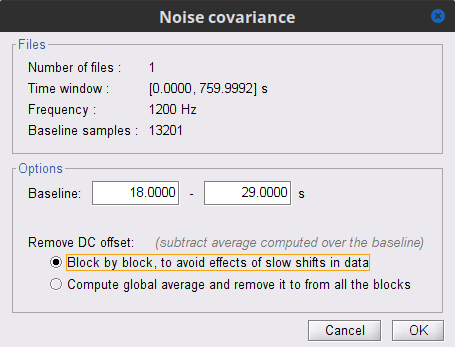
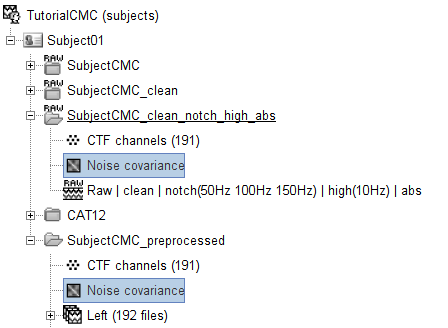
Lastly, copy the Noise covariance node to the SubjectCMC_clean_notch_high_abs folder with the head model. This can be done with the shortcuts Ctrl-C and Ctrl-V.
Source estimation
Noe that the head model(s) and noise covariance have been computed, we can use the minimum norm imaging method to solve the inverse problem. The result is a linear inversion kernel, that estimates the source brain activity that gives origin to the observed recordings in the sensors. Note that, an inversion kernel is obtained for each of the head models: surface and volume. See the source estimation tutorial for more details.
Cortex surface
Compute the inversion kernel, right-click in the Overlapping spheres (surface) head model and select Compute sources [2018]. With the parameters:
Minimum norm imaging
Current density map
Unconstrained
Comment = MN: MEG surface
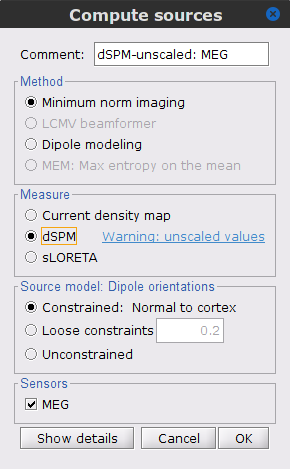
The inversion kernel dSPM-unscaled: MEG(Constr) 2018 was created, and note that the each recordings node has an associated source link.
Scouts
To gather sources, surface and volume scouts
Surface scouts
See the units We need to add the Surface scouts. Open a source file, then the tab Scout. then the menu Atlas > From subject anatomy > AAL3 (MNI-linear)
Volume scouts
See the units We need to add the Surface scouts. Open a source file, then the tab Scout. then the menu Atlas > From subject anatomy > AAL3 (MNI-linear)
Coherence (source level)
[TO DISCUSS among authors] Better source localization can be obtained by performing MRI segmentation with CAT12. Although it adds between ~45min of additional processing. We may want to provide the already processed MRI. Thoughts?
From the earlier section importing anatomy data, we can observe that the cortex surface has 10,000 vertices, thus as many sources were estimated. AS it can be seen, it is not practical to compute coherence between the left EMG signal and each source. A way to address this issue is with the use of regions of interest or Scouts.
Double-click the source link for any of the trials to visualize the source space. This will enable the tab Scout in the main Brainstorm window.
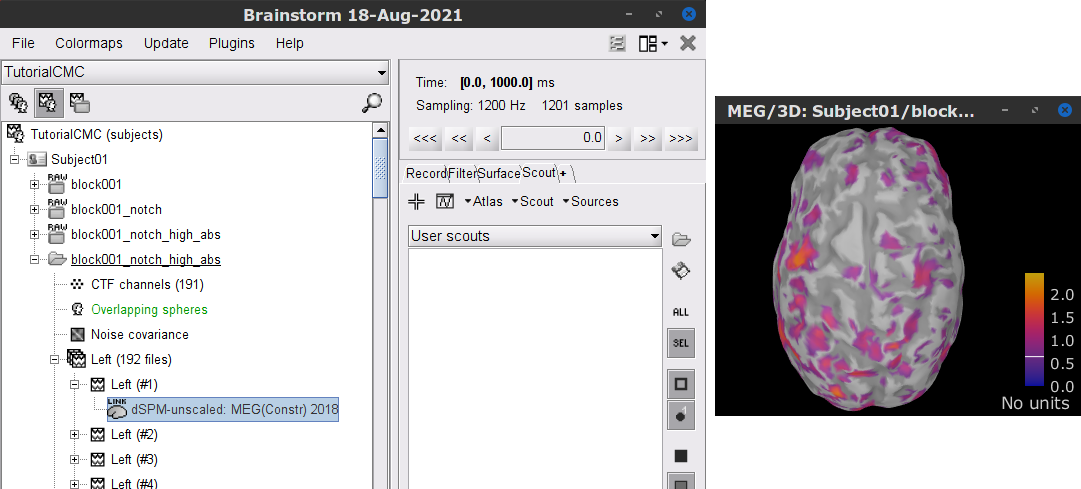
In the Scout tab select the menu Atlas > Surface clustering > Homogeneous parcellation (deterministic), and set the Number of scouts to 80.
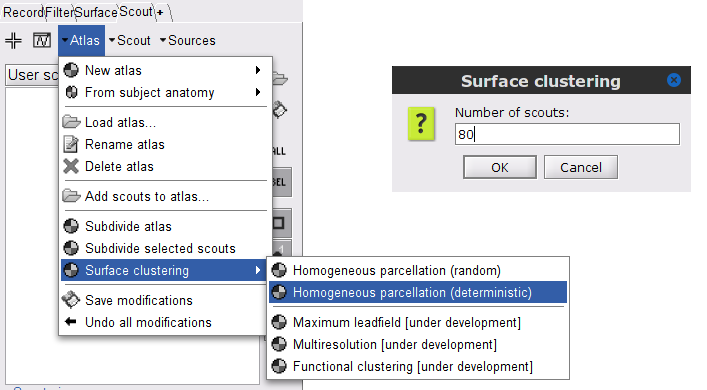
It is important to note that the coherence will be performed between a sensor signal (EMG) and source signals in the scouts.
Change to the Process2 tab, and drag-and-drop the Left (192 files) trial group into the Files A and into the Files B boxes. And select Process recordings for Files A, and Process sources for Files B.
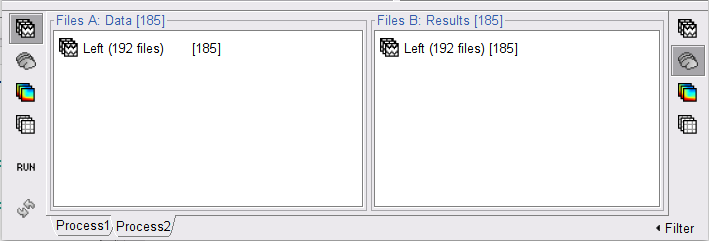
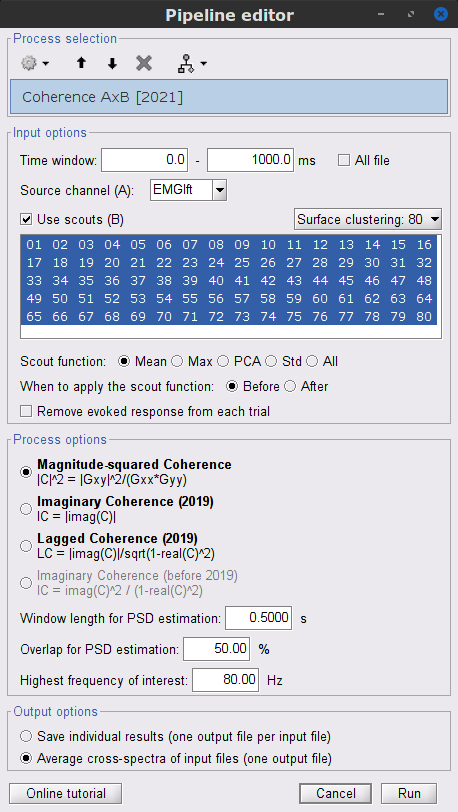
Run the process Connectivity > Coherence AxB [2021] with the following parameters:
All file, Source channel (A) = EMGlft, check Use scouts (B)
Select Surface clustering: 80 in the drop-down list, and select all the scouts (shortcut Ctrl-A).
Scout function = Mean, and When to apply = Before. Do not Remove evoked responses from each trial.
Magnitude squared coherence, Window length = 0.5 s, Overlap = 50%, Highest frequency = 80 Hz, and Average cross-spectra.
Results with FieldTrip MRI segmentation
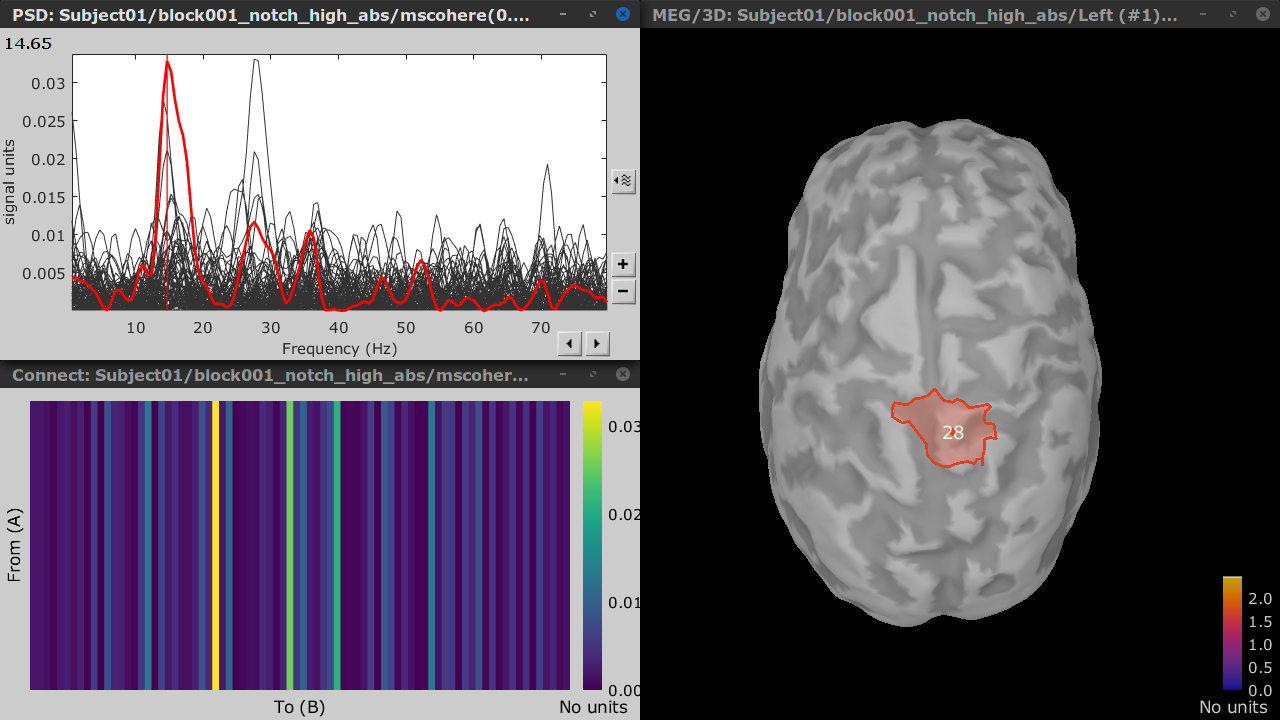
Double-click on the resulting node mscohere(0.6Hz,555win): Left (#1) to display the coherence spectra. Also open the result node as image with Display image in its context menu.
To verify the location of the scouts on the cortex surface, double-click the source link for any of the trials. In the Surface tab, set the Amplitude threshold to 100% to hide all the cortical activations. Laslty, in the Scouts tab, select the Show only the selected scouts and the Show/hide the scout labels. Note that the plots are linked by the scout selected in the image representation of the coherence results.
Results with FieldTrip MRI segmentation
[TO DISCUSS among authors] Same as the previous section but using the surface from CAT, and using DK atlas. 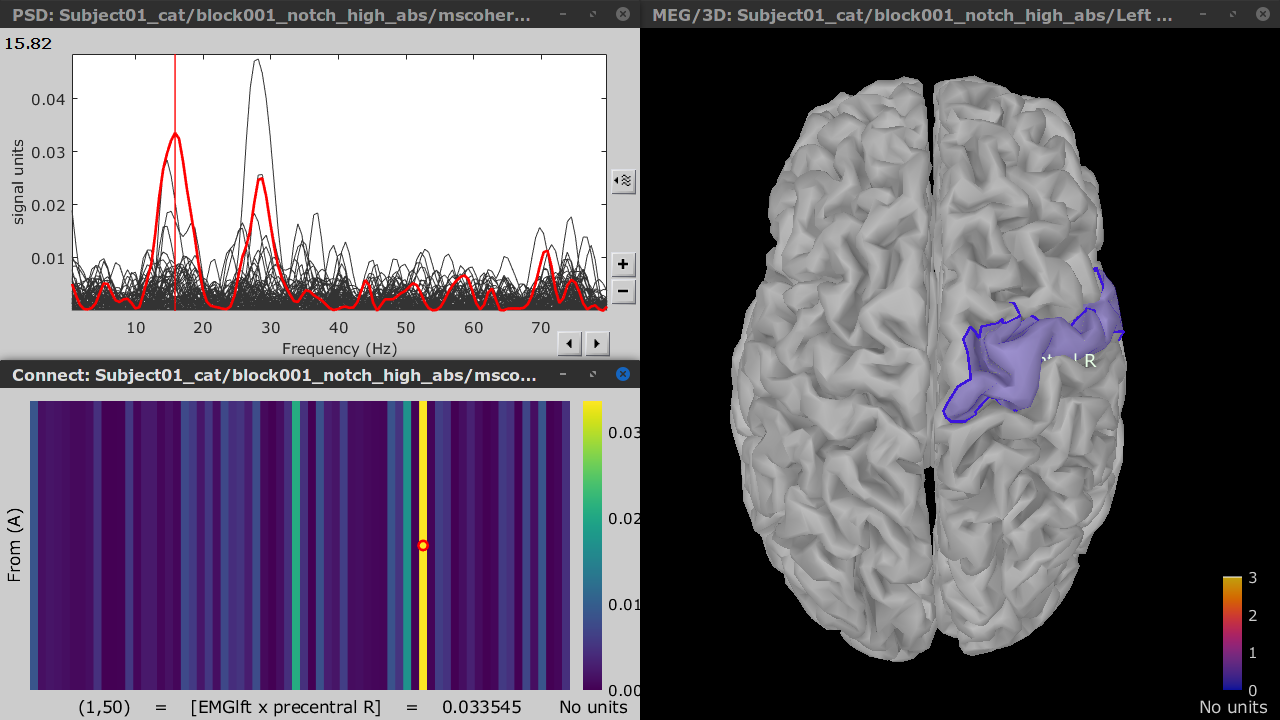
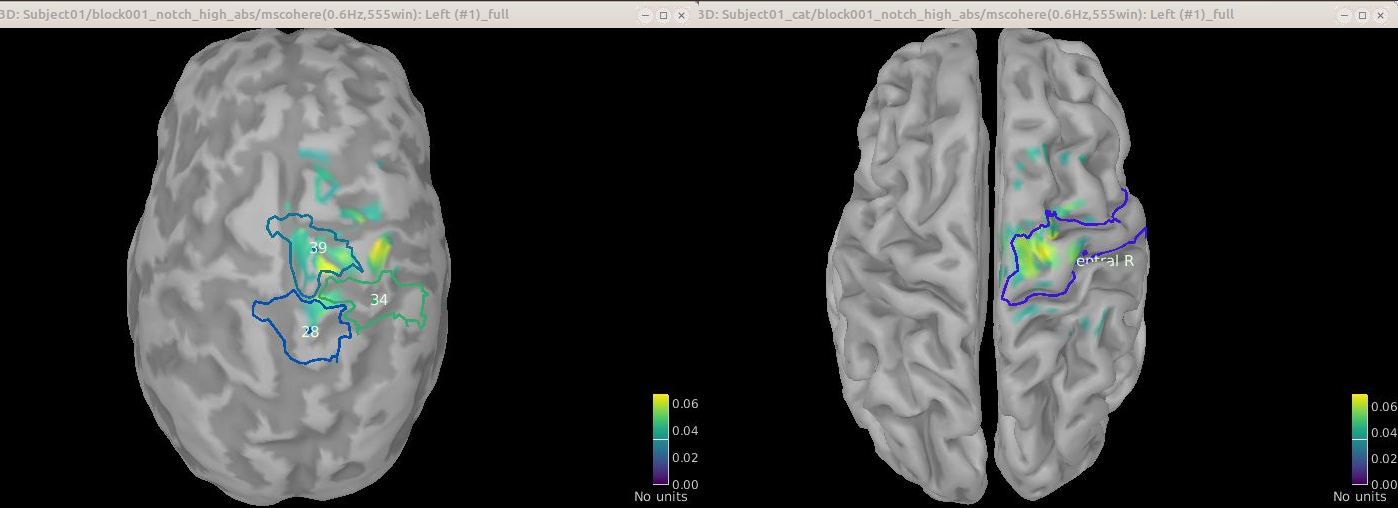
[TO DISCUSS among authors] In addition I barely ran the Coherence (as it took up to 30GB) for all the vertices vs EMG Left for the source estimation using the ?FielfTrip and the CAT12 segmentations
Comparison for 14.65 Hz
Sweeping from 0 to 80 Hz
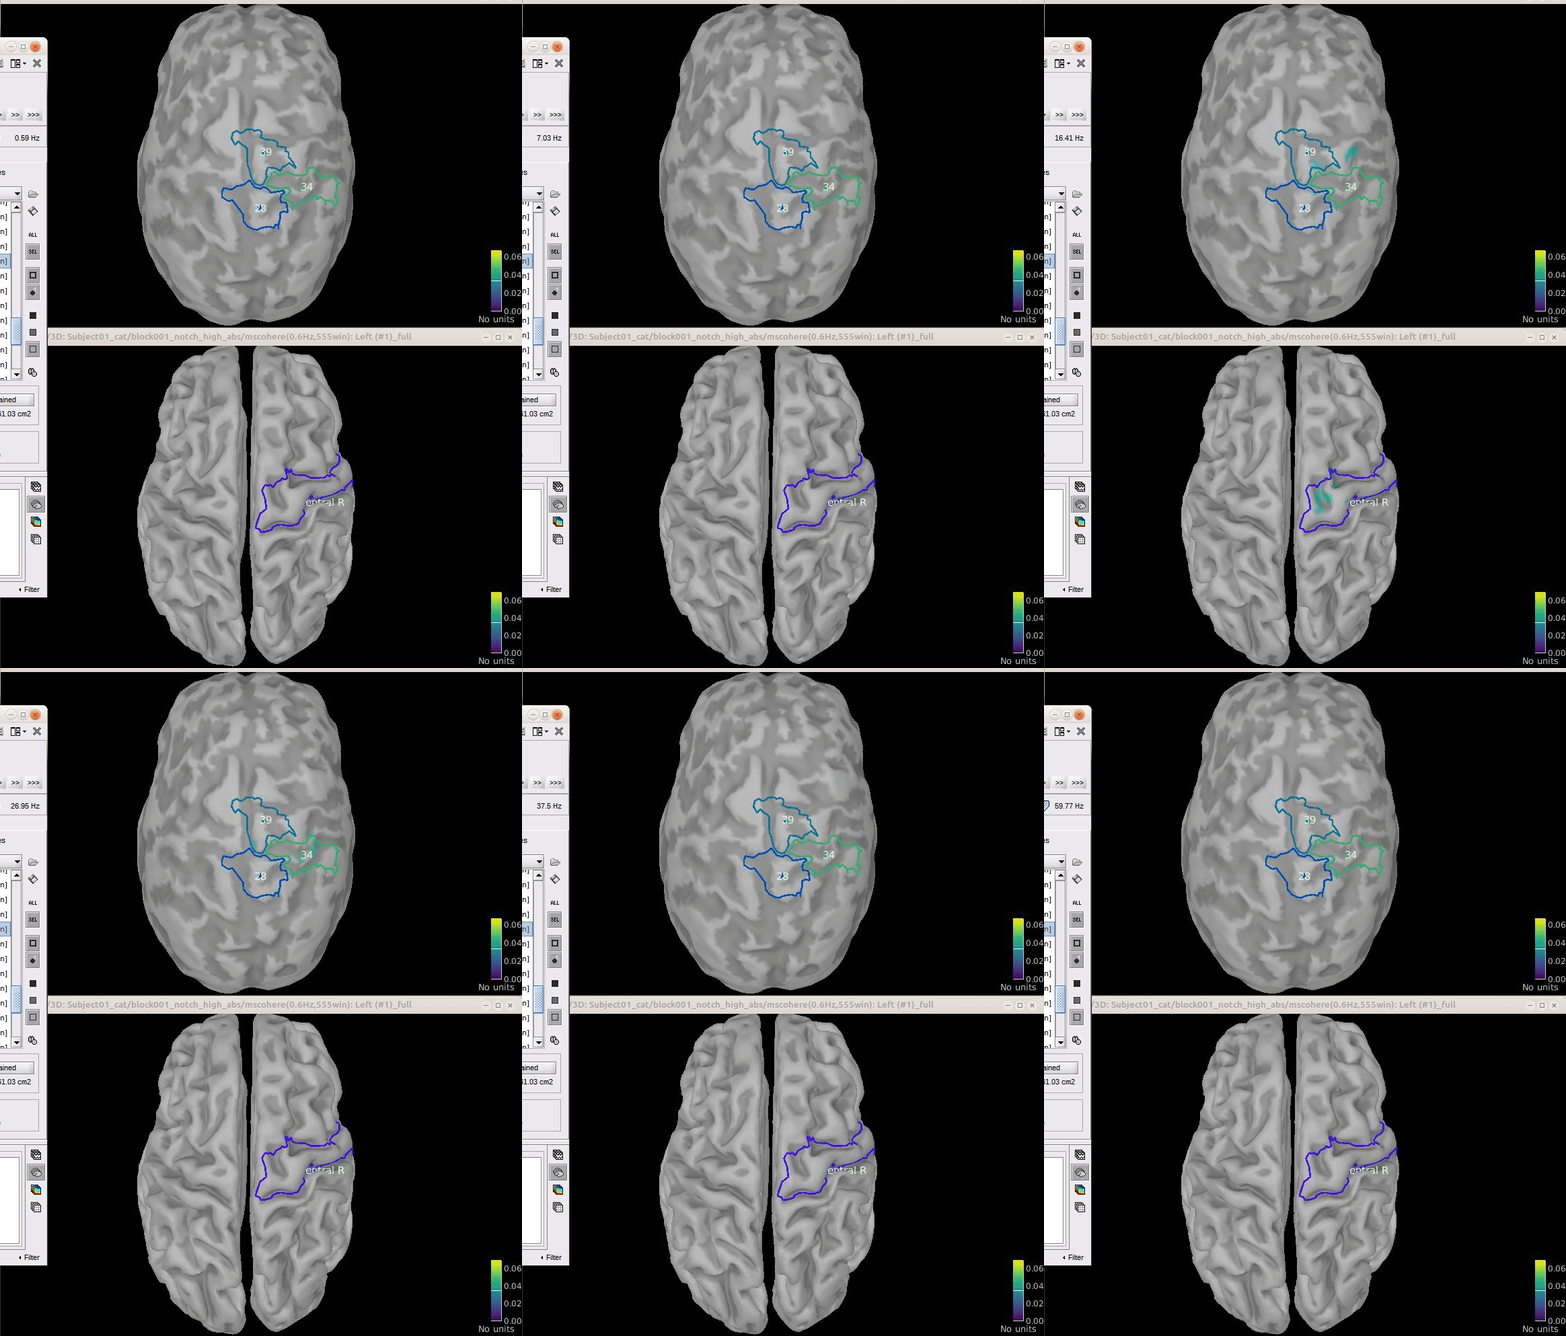
Script
[TO DO] Once we agree on all the steps above.
Additional documentation
Articles
Conway BA, Halliday DM, Farmer SF, Shahani U, Maas P, Weir AI, et al.
Synchronization between motor cortex and spinal motoneuronal pool during the performance of a maintained motor task in man.
The Journal of Physiology. 1995 Dec 15;489(3):917–24.Kilner JM, Baker SN, Salenius S, Hari R, Lemon RN.
Human Cortical Muscle Coherence Is Directly Related to Specific Motor Parameters.
J Neurosci. 2000 Dec 1;20(23):8838–45.Liu J, Sheng Y, Liu H.
https://doi.org/10.3389/fnhum.2019.00100Corticomuscular%20Coherence%20and%20Its%20Applications:%20A%20Review. Front Hum Neurosci. 2019 Mar 20;13:100.
Tutorials
Tutorial: Volume source estimation
Tutorial: Functional connectivity
Forum discussions
[TO DO] Find relevant Forum posts.

