|
Size: 19027
Comment:
|
Size: 28477
Comment:
|
| Deletions are marked like this. | Additions are marked like this. |
| Line 1: | Line 1: |
| ## page was renamed from Tutorials/DuneuroMunsterData '''[TUTORIAL UNDER CONSTRUCTION]''' It Will be completed soon In this tutorial, we describe the full FEM process as described in the SPIE paper We may keep the previous tutorial as basic and this tutorial is an advanced and complete version. |
'''[TUTORIAL UNDER CONSTRUCTION: NOT READY FOR PUBLIC USE]''' ---- |
| Line 11: | Line 6: |
| ''Authors: Takfarinas Medani, Juan Garcia-Prieto, Wayne Mead.'' This tutorial introduces the FEM modeling in the Brainstorm environment. |
''Authors: Takfarinas Medani, Juan Garcia-Prieto, Wayne Mead, Michael Funke, Francois Tadel '' This tutorial introduces the most advanced FEM modeling options available in the Brainstorm environment, applied to MEG+EEG recordings of a median nerve stimulation. The pipeline presented here includes: FEM mesh reconstruction with SimNIBS/CAT12, FEM head model including DTI tensors for modeling anisotropic conductivities (using BrainSuite), FEM forward model estimation with DUNEuro. This pipeline requires many third-party programs and very long computation times. For a simpler FEM pipeline, please refer to the tutorial: [[https://neuroimage.usc.edu/brainstorm/Tutorials/Duneuro|Realistic head model: FEM with DUNEuro]]. |
| Line 19: | Line 14: |
| == License == This tutorial dataset (MEG/EEG and MRI data) remains proprietary of xxxxyyyy. Its use and transfer outside the Brainstorm tutorial, e.g. for research purposes, is xxxx yyy. '''''__Download the dataset__''''' * Get the open access reference data set from''' '''here''' : '''[[https://urldefense.com/v3/__https://zenodo.org/record/3888381__;!!LIr3w8kk_Xxm!6KhbFOL7K9swpYSnYrC6ZOtj6uGhoULw9qgkmW75irYricc0ITrt_Do95QkqIQ$|https://zenodo.org/record/3888381]] * The following data are used in the advanced tutorial [[https://neuroimage.usc.edu/brainstorm/Tutorials/DuneuroMunsterData|FEM head modeling]] * Requirement Brainstom SimNibs BrainSuite Iso2mesh == Description of the experiment (todo) : only one file == The experiment consists of two stimulation protocols being conducted during a single scanning session in a MEG laboratory with an Elekta Triux (Megin, Finland) scanner. The subject is a right-handed 46 years old male. The two stimulation protocols consist of unilateral median nerve stimulation and an eyes-closed resting-state recording. Median nerve stimulation: * The stimulation signal was a square-wave pulse with 2Hz frequency and duration of 0.2ms. * An ISI (inter-stimulus interval) of 500ms with a variation of ±20ms in order to be able to average out time-locked noise to the stimulation, while remaining unnoticeable by the subject. * The stimulation was performed on both hands/wrists, independently, with a Digitimer DS7A stimulator. An electrode was placed on each current value were tuned to match the motor threshold of the subject on the stimulated hand, with a result of 10~12mA approximately. * Initially, the left wrist was stimulated for approximately 2 minutes (this corresponds with the file containing L1 in its name). After a 2-minute rest, while sitting in the MSR and with his head in the helmet, the stimulation was repeated (L2 file). After this stimulation, the subject was asked to have a 10 minutes rest, during which he was allowed to sit calmly with his head out of the helmet, although remaining hooked to the scanner at all times. Finally, two subsequent runs of right wrist stimulation (R1 and R2 files) with an intermediate 2-minute rest were performed. * Recordings were performed with a 1kHz sampling rate. Continuous HPI was disabled during these recordings. And high-pass filters were set to DC for MEG channels and 0.03Hz for EEG channels. * All files underwent a MaxFilter (version 2.3.13) tsss post-processing. Resting-State protocol: * The subject was recorded for approximately 80 minutes. Due to a 2GB maximum-size limitation for FIFF files, this translates into the recording being saved in files 'epi1' to 'epi4'. * The subject had his eyes closed. * Recordings were performed with a 1kHz sampling rate. Continuos HPI was enabled. High-pass filters were set to DC for MEG channels and 0.03Hz for EEG channels. * All files underwent a MaxFilter (version 2.3.13) tsss post-processing, with motion compensation active. |
<<Include(DatasetFem, , from="\<\<HTML\(\<!-- START-PAGE --\>\)\>\>", to="\<\<HTML\(\<!-- STOP-SHORT --\>\)\>\>")>> |
| Line 60: | Line 17: |
| * Requirements: You have already followed all the introduction tutorials and you have a working copy of Brainstorm installed on your computer. * Go to the [[http://neuroimage.usc.edu/bst/download.php|Download]] page of this website, and download the file: '''sample_tutoFEMadvance.zip''' * Unzip it in a folder that is not in any of the Brainstorm folders (program or database folder) |
==== Requirements ==== * You have already followed all the introduction tutorials. * You have a working copy of Brainstorm installed on your computer. ==== Additional programs ==== You need to install the following programs (listed by order of appearance): * '''SimNIBS''': See tutorial: [[https://neuroimage.usc.edu/brainstorm/Tutorials/FemMesh#SimNIBS|FEM mesh generation]] * '''BrainSuite''': See tutorial: [[https://neuroimage.usc.edu/brainstorm/Tutorials/FemTensors#Brainsuite_Installation|FEM tensors estimation]] * '''MATLAB Runtime''': Follow the instructions on the BrainSuite download page * '''SPM12''': Install as [[https://neuroimage.usc.edu/brainstorm/Tutorials/Plugins|Brainstorm plugins]] * '''CAT12''': Install as [[https://neuroimage.usc.edu/brainstorm/Tutorials/Plugins|Brainstorm plugins]] * '''Iso2mesh''': Install as [[https://neuroimage.usc.edu/brainstorm/Tutorials/Plugins|Brainstorm plugins]] * '''DUNEuro''': See tutorial: [[https://neuroimage.usc.edu/brainstorm/Tutorials/Duneuro|Realistic head model: FEM with DUNEuro]] ==== Download the dataset ==== * Go to the [[http://neuroimage.usc.edu/bst/download.php|Download]] page and get the file: '''sample_fem.zip''' * Unzip it outside of any of the Brainstorm folders (program folder or database folder). |
| Line 66: | Line 36: |
| * Select the menu File > Create new protocol. Name it "'''tutoFEMadvanced'''" and select the options: * "'''No, use individual anatomy'''", * "'''No, use one channel file per condition'''". == Import the MRIs == |
* Select the menu File > Create new protocol. Name it "'''TutorialFem'''" and select: * No, use individual anatomy * No, use one channel file per condition == Import the anatomy == === T1 MRI === |
| Line 73: | Line 43: |
| * Right-click on the tutoFEMadvanced folder > New subject > '''Subject01''' * Leave the default options you set for the protocol * Right-click on the subject node > Import anatomy MRI: Navigate to the selected folder and then select the T1 MRI, with the name "T1.nii" * Set the 6 required fiducial points (indicated in MRI coordinates). Fiducials point not always have to be located where we recommend in our [[https://neuroimage.usc.edu/brainstorm/Tutorials/ImportAnatomy#Fiducial_points|introductory]] and our [[https://neuroimage.usc.edu/brainstorm/CoordinateSystems?highlight=(auricular)|coordinate systems]] tutorials. Every subject is different and sometimes things get in the way, and it is not possible to follow canonical recommendations. That is fine! As long as there is a correct correspondence between fiducial points in the fif file and in the MRI, everything works fine. * For the following subject you can use these values :<<BR>> . . - NAS: [121, 214, 50] . - LPA: [45, 111, 31] . - RPA: [174, 114, 56] . - AC: [120, 130, 75] . - PC: [120, 101, 73] . - IH: [120, 110, 132] * Click on the link "''' Click here to compute MNI transformation'''" and keep the default values. * Load the T2, by following the same process as previous, then select the T2 MRI with the name "m46wap_t2.nii". Brainstorm will ask you to register the T2 to the T1, select the SPM option (require to have SPM installed), then reslice the T2, select "Yes". This process will take few minutes. == Head model construction == === FEM head model === The first step requires the generation of the FEM head model, where the MRIs are segmented into the main tissues and then tesselated into hexahedral or tetrahedral elements. The available methods within Brainstorm are listed in [[https://neuroimage.usc.edu/brainstorm/Tutorials/FemMesh|this page]]. In the following tutorial, the SimNibs method is used * Select both the T1 and the T2 MRIs, using the mouse and the "Shift" key * Right-click on and then select the "Generate FEM mesh" * Select the SimNIbs method from the panel and keep the default options. In order to use the call SimNibs you need to have it installed on your computer, please follow the instruction as explained in [[https://neuroimage.usc.edu/brainstorm/Tutorials/FemMesh#SimNIBS|here]]. Keep all the options to their default values. Depending on your computer performance, this process can take 2 to 4 hours, so be patient. {{attachment:generateFEMmeshSimNibs2.png||height="150",width="600"}} At the end of this computation, Brainstorm will populate the windows with the following nodes * tissues: the segmentation output of the MRIs * FEM 72358V (simnibs, 5 layers) : the FEM mesh of the MRIs with 72353 vertices, generated with the method SimNibs and the model has 5 layers (wm, gm, csf, skull, and scalp). * Head mask: the outer surface of the scalp (or the head) * cortex_fem: the outer surface mesh of the grey matter * cortex_280753V: the pial surface generated by spm/cat within the SimNibs process * cortex_15002V : low version of the cortex_280753 |
* Right-click on the TutorialFem folder > New subject > '''Subject01''' * Keep the default options you set for the protocol. * Right-click on the subject node > '''Import MRI''': * Set the file format: '''All MRI files (subject space)''' * Select the T1 file: sub-fem01/ses-mri/anat/'''sub-fem01_ses-mri_T1w.nii.gz''' * Click on the link "'''Click here to compute MNI normalization'''": option "'''maff8'''".<<BR>>This estimates an affine transformation to the [[https://neuroimage.usc.edu/brainstorm/CoordinateSystems#MNI_coordinates|MNI space]] and sets default positions for the anatomical fiducials. Because we will use the digitized head shape of the subject to [[https://neuroimage.usc.edu/brainstorm/Tutorials/ChannelFile#Automatic_registration|refine the MRI/MEG registration]], we don't need the position of the fiducials to be very accurate.<<BR>><<BR>> {{attachment:importT1.gif}} === T2 MRI === * Right-click on the subject node > '''Import MRI''': * Set the file format: '''All MRI files (subject space)''' * Select the T2 file: sub-fem01/ses-mri/anat/'''sub-fem01_ses-mri_T2w.nii.gz''' * Brainstorm asks about registering the new T2 with the reference T1 image: * Select the option: '''SPM''' * Reslice the volume: '''Yes''' * This process will take few minutes, just be patient.<<BR>><<BR>> {{attachment:importT2.gif}} === Diffusion imaging === The FEM has the ability to incorporate anisotropic conductivity from MRI diffusion imaging, which is particularly interesting for the modeling of the white matter. Brainstorm can load the Diffusion-Weighted Images (DWI), and compute the tensors (DTI) using the [[Tutorials/FemTensors|BrainSuite Diffusion Pipeline]] (BDP). This requires BrainSuite to be installed on your computer, with the bdp program available in the system path. * Right-click on Subject01''' '''> '''Convert DWI to DTI''' * Select the DWI file: sub-fem01/ses-mri/dwi/'''sub-fem01_ses-mri_dwi.nii.gz''' * The associated files *dwi.bvec and *dwi.bval must be in the same folder. * The process can take up to 30min. At the end, a new file '''DTI-EIG''' appears in the database. This file contains 12 volumes, ie. 12 values for each voxel. From 1 to 9: components of the three eigenvectors; from 10 to 12: the values of their norm to the eigenvalue. <<BR>><<BR>> {{attachment:importDTI.gif}} == FEM head model == The FEM approach requires a segmentation of the head volume in different tissues, represented as hexahedral or tetrahedral 3D meshes. The methods available within Brainstorm are listed in the tutorial [[Tutorials/FemMesh|FEM mesh generation]]. Here we illustrate only the use of SimNIBS. === FEM mesh with SimNIBS === Running SimNIBS: * Select both the T1 and the T2 MRIs, using the mouse and the SHIFT or CTRL keys. * Right-click on the selected files > MRI segmentation > '''Generate FEM mesh''' > '''SimNIBS'''. Keep the default options. * This process can take 2-5 hours. * The output of SimNIBS is saved in the temporary folder $HOME/.brainstorm/tmp/simnibs, and then imported into the Brainstorm database. At the end of this computation, new files are available in the database: * '''tissues''': Segmentation of the head volume in 6 different tissues * '''head mask''': Outer surface of the scalp * '''cortex_280000V''': Pial surface generated by CAT12 within the SimNIBS process * '''cortex_15002V''': Low-resolution version of the pial surface * '''cortex_fem''': Outer surface mesh of the gray matter, extracted from the FEM mes * '''FEM 70000V''': Tetrahedral FEM mesh with 5 layers (gm, wm, CSF, skull, scalp). |
| Line 124: | Line 102: |
| {{attachment:simnibs.gif}} === Remesh with Iso2mesh === In some cases, the FEM mesh generated with SimNibs causes issues with the DUNEuro FEM solver, due to the air cavities that are not tesselated. In order to avoid these possible issues in the next steps, we will correct the mesh using the Iso2mesh functions integrated within Brainstorm. * Right-click on the FEM mesh > '''Extract surfaces'''. * Hold the CTRL key to select all the extracted surfaces (white, gray, csf, skull, scalp). * Right-click > '''Generate FEM mesh''' > '''Iso2mesh-2021''' > '''MergeMesh''' > Max volume = '''0.001''', Percentage kept = '''100'''. Note that the higher the resolution leads to higher accuracy but also higher memory requirements and longer computation times.<<BR>><<BR>> {{attachment:remeshHeadIso2mesh.jpg||height="150",width="600"}} The following figure shows the two model, left is the initial model obtained with SimNibs, right is the second model obtained from the Iso2Mesh remesh: the air cavity in the bottom-right corner is now fully tesselated. Note that you can also use this process to generate FEM models with higher mesh densities. {{attachment:femMeshSimNibsVSiso2mesh2.jpg||height="150",width="600"}} |
|
| Line 125: | Line 116: |
| The FEM has the ability to incorporate anisotropic conductivity. Brainstorm offers the known methods to estimate the tensors from the DWI data. For a more detailed example please [[https://neuroimage.usc.edu/brainstorm/FemTensors|refere to this page.]] There are two main phases to compute the tensors, the first is the computation of the DTI from the DWI. The second is the estimation of the conductivity tensors from the DTI on each of the FEM mesh elements. __'''Step one: ''' __ * Right-click on the '''Subject01 '''> "Convert DWI to DTI" * Select the DWI data from the folder, "dwi.nii", the associated files "dwi.bvec" and "dwi.bval" must be in the same folder (same name but different extensions) {{attachment:compute&DisplayTensors.png|compute&DisplayTensors.png|height="150",width="600"}} BrainStorm will call internally the Brainsuite Software to compute the DTI. This process can take up to 20 minutes. At the end of this process, a node will appear in the Brainstorm database explorer under the name "DTI-EIG", this is a volume data that contains the 12 values of the eigenvalues and eigenvectors at each voxel. ''__Explanation of the options:__'' Brainstorm recognizes the tissue listed on the FEM had and assigns the default isotropic conductivities, as shown on the panel, users can change and use their own values. When the DWI data are computed, the conductivity tensors can be estimated on the white matter tissues using the Effective Medium Approach (EMA), Brainstorm offers two option, the EMA with a fixed factor k=0.736, or the EMA with the volume constraint (EMA+VC), please refer to this tutorial and the cited publication for further information. __'''Step two:''' __ Once the DTIs are computed, * Richt click on the FEM mesh and then '''"Compute FEM tensors"''' * From the panel select the options as shown in the following figure, then hit "Ok" {{attachment:computeDTI.png||height="150",width="600"}} This process can take up to 5min, depending on the resolution of the FEM mesh. __'''Visualisation of the FEM mesh and tensors''' __ |
We can now incorporate the diffusion information into the FEM model, and compute anisotropic conductivity tensors for the tetrahedral elements of the white matter (we consider the other tissues to have isotropic conductivities). * Right-click on the FEM mesh > '''Compute FEM tensors'''. Select the options as illustrated below, and refer to the tutorial [[Tutorials/FemTensors|FEM tensors]] for more information. <<BR>><<BR>> {{attachment:computeTensors.gif}} * This process can take up to 5min, depending on the resolution of the FEM mesh. === Visualization === |
| Line 165: | Line 126: |
| The FEM tensors can be also displayed either on the mesh or on the MRI, to do so, right-click on the FEM mesh, then "Display FEM tensors", you can choose the displaying mode, the tensors can be displayed either as arrows (line) on the main eigenvector or as ellipsoids, on each FEM element (tetrahedron). | Right-click on the FEM mesh > '''Display FEM tensors''': The FEM tensors can be displayed on the mesh or MRI, as arrows on the main eigenvector or as ellipsoids on each FEM element. |
| Line 173: | Line 134: |
| The size of the displayed tensors can be changed from the keyboard with the "Up" or "Down " arrows keys. You can also switch the display mode (from lines to ellipsoids to line or inversely) by using the shortcut "Shift + Space". | To configure the display: right-click on the figure > '''FEM tensors''' menu. The keyboard shortcuts for changing the size of the displayed tensors are the '''Up''' and '''Down''' arrows keys. You can also switch the display mode by using the shortcut "Shift + Space". <<TAG(Advanced)>> === On the hard drive === The '''DTI-EIG''' file as the same structure as any [[https://neuroimage.usc.edu/brainstorm/Tutorials/ExploreAnatomy#On_the_hard_drive:_MRI|MRI file]], with 12 volumes stacked along the 4th dimension. From 1 to 9: components of the three eigenvectors; from 10 to 12: the values of their norm to the eigenvalue. The '''FEM''' mesh contains the following fields: * <<BR>><<BR>> {{attachment:femDataOnHardDisc.png||height="150",width="600"}} |
| Line 176: | Line 146: |
| We will generate also the BEM surfaces for this subject and we will follow the same step as expect in [[https://neuroimage.usc.edu/brainstorm/Tutorials/TutBem?highlight=(bem)#Brainstorm|this page]]. The obtained surfaces will be used later for the BEM source computation. Richt-click on the subject and then "Generate BEM surfaces", then keep the default options. <<TAG(Advanced)>> === On the hard disc === femDataOnHardDisc.png |
For the purpose of comparison between the FEM and the BEM, we will generate also the BEM surfaces for this subject and we will follow the same step as explained in the [[Tutorials/TutBem|BEM tutorial]]. * Right-click on Subject01 > MRI segmentation > '''Generate BEM surfaces''' > '''Brainstorm'''.<<BR>>Keep the default options: 1922 vertices for all the layers, skull thickness = 4m. * Three new files appear in the database explorer: bem_head_1922V, bem_outerskull_1922V, and bem_innerskull_1922V. These surfaces will be used for the BEM forward computation. * Now we have two head geometry available for this subject, BEM and FEM {{attachment:fem&bemModels.jpg|fem&bemModels.jpg|height="150",width="600"}} |
| Line 192: | Line 155: |
| * The folder "eeg_positions" which contains default 10-10 EEG electrodes positions, was generated by the SimNIBS process. We will not use it in this tutorial: '''delete this folder'''. | |
| Line 193: | Line 157: |
| * Select the file type: "MEG/EEG: Electa-Neuromag(*.fif)" * Navigate to the downloaded folder and select the file "vp_median_rerve_R1_raw_tsss_anon.fif" * Ignore the warning * Apply the refine registration to the head points * A figure is opened to show the current registration MRI/MEG. It is already quite good * The new file "Link to raw file" lets you access directly the contents of the MEG/EEG recordings * The "Neuromag channels(374)" contains the name of the channels and the position of the corresponding sensors (MEG/EEG) {{attachment:reviewMEEGsensors.jpg||height="150",width="600"}} === Prepare the channel file === |
* Select file type: MEG/EEG: Electa-Neuromag(*.fif) * Select file: sub-fem01/ses-meg/meg/'''sub-fem01_ses-meg_task-mediannerve_run-01_proc-tsss_meg.fif''' * FIF event file: Select '''Event Channe'''l, this will read the events markers * Refine registration? '''YES''' * A figure is opened to show the registration MRI/MEG.<<BR>><<BR>> {{attachment:registration.gif||height="243",width="305"}} * The new file "Link to raw file" lets you access directly the contents of the MEG/EEG recordings. The "Neuromag channels (374)" contains the name of the channels and the position of the corresponding sensors (MEG/EEG). === Channel file === |
| Line 205: | Line 166: |
| * 306 MEG channels | * 306 MEG channels (102 magnetometers and 204 gradiometers ) |
| Line 209: | Line 170: |
=== Refine the MRI registration === * Right-click on the channel file > MRI registration > Edit... (EEG) |
* Right-click on the channel file > '''MRI registration''' > '''Edit... (EEG) ''' |
| Line 213: | Line 172: |
| * Now try to manipulate the position of the EEG+MEG sensors using '''rotations '''and '''translations '''only (no "resize" or individual electrodes adjustments). The objective is to have all the points close to the surface and the three forehead points inside the little peaks on the surface (due to markers in the MRI). * The rotation+translation are going to be applied both to the EEG and the MEG sensors. After you are done with this solid registration part, you can click on the button '''"Project electrodes on scalp surface"''', it will help for the source modeling later. The green points (digitized) stay in place, the white points (electrodes) are now projected on the skin of the subject. * If you feel like you didn't do this correctly, close the figure and cancel the modifications, then try again. It takes a few trials to get used to this rotation/translation interface. * Click on '''[OK]''' when done. * Answer '''YES''' to save the modifications. * Answer '''YES''' again to apply the solid transformation (rotation+translation) to the MEG sensors. * Now all the electrodes are projected on the surface. * (refine head with digitized points) {{attachment:MEEGsensors.jpg||height="150",width="600"}} === Read the stimulation information === * Right-click on the "Link to raw file" > Stim> Display time series * You can see the time series which contains the information of the electric stimulation. We are going to read this trigger channel as a list of events. {{attachment:stimTimeSerie.jpg||height="150",width="600"}} In the Record tab, menu '''File > Read events from channel'''. * Event channel = '''Stim''' * Option selected "'''TTL'''": detect peaks of 5V/12V on an analog channel. * Do not select the option Accept zeros as trigger values * Check that the peaks of the triggers channel have been correctly identified, then close this figure. {{attachment:stimEvents.jpg||height="400",width="600"}} == Pre-processing == === Evaluate the recordings === |
* The automatic registration based on the head points is already good, therefore we won't apply any additional rotation+translation to the MEG+EEG sensors. * Click on the button '''"Project electrodes on scalp surface"''', it will help for the source modeling later. The green points (digitized) stay in place, the white points (electrodes) are now projected on the skin of the subject. * If you feel like you didn't do this correctly, close the figure and cancel the modifications, then try again. * Click on '''[OK]''' when done. Answer '''YES''' to save the modifications. === Pre-processing === |
| Line 243: | Line 180: |
| * After the computation, double-click on the new PSD file to display it. {{attachment:psd.jpg||height="500",width="600"}} * The lines on the top represent the EEG electrodes, the lines at the bottom the MEG sensors(MAG and GRAD). If you want to get clearer plots, you can calculate separately the spectrum for the two types of sensors separately, by running twice the process "Power spectrum density" , once with sensor types = "MEG" and once with "EEG", instead of running in on both at the same time like we did. |
* After the computation, double-click on the new PSD file to display it.<<BR>><<BR>> {{attachment:psd.jpg||height="500",width="600"}} * The lines on the top represent the EEG electrodes, the lines at the bottom the MEG sensors(MAG and GRAD). If you want to get clearer plots, you can calculate separately the spectrum for the two types of sensors separately, by running twice the process "Power spectrum density", once with sensor types = "MEG" and once with "EEG", instead of running in on both at the same time as we did. |
| Line 257: | Line 192: |
| * Select process '''Pre-process > Band-pass filter''': Frequency='''[0.5, 200]Hz''', Sensors='''MEG,EEG''' * Add processs '''Pre-process > Notch filter''': Frequencies='''[60 120 180]Hz''', Sensors='''MEG,EEG''' {{attachment:freqFilters.jpg||height="500",width="600"}} |
* Select process '''Pre-process > Band-pass filter''': Frequency='''[20, 250]Hz''', Sensors='''MEG,EEG''' * Add process '''Pre-process > Notch filter''': Frequencies='''[60 120 180]Hz''', Sensors='''MEG,EEG'''<<BR>><<BR>> {{attachment:freqFilters.jpg||height="500",width="600"}} |
| Line 263: | Line 196: |
| * Run the process "'''Frequency > Power spectrum density'''", with the same options as before. And compare with the previous figure. You may find that the power line frequency and its harmonies are removed. . == Review the recordings == |
* Run the process "'''Frequency > Power spectrum density'''", with the same options as before. And compare with the previous figure. You may find that the power line frequency and its harmonics are removed and the data is filtered between 20 and 250Hz.<<BR>><<BR>> {{attachment:spectreClean.jpg||height="500",width="600"}} * To keep the interface clean and easy to follow: keep only the last continuous file (Raw|Band|Notch). Delete the link to the original file (which will not delete the original .fif file), and delete the "Raw|Band" file. |
| Line 270: | Line 201: |
| * In the Record tab, menu '''Artifacts > Re-reference EEG''' > "AVERAGE". {{attachment:avgRef.jpg||height="500",width="600"}} |
* In the Record tab, menu '''Artifacts > Re-reference EEG''' > "AVERAGE".<<BR>><<BR>> {{attachment:avgRef.jpg||height="500",width="600"}} |
| Line 276: | Line 205: |
| == Artifacts cleaning with ICA == === Detect heartbeats and blinks === * Right-click on the filtered file "Raw|band|notch" > EEG > Display time series. * In the Record tab, menu '''Artifacts > Detect heartbeat''': channel '''ECG001''' * In the Record tab, menu '''Events > Detect eye blinks''': channel '''EOG002''' * In the Record tab, menu '''Events > Remove simultaneous''': "cardiac" / "blink" / 250ms. * The heartbeats are correctly detected, but not the eye movements. There are not only blinks but also a lot of slow eye movements in these recordings. We will prefer an ICA approach, rather than a SSP decomposition which is more adapted to recordings with only clean blinks. [[http://neuroimage.usc.edu/brainstorm/Tutorials/Epilepsy#Artifact_cleaning_with_ICA|More information about ICA]]. * === EEG: Heartbeats and eye movements === * * === MEG: Heartbeats and eye movements === * == Epoching and averaging == === Import the recordings === |
=== Epoching === In this experiment, the electric stimulation is sent with a frequency of 2Hz, meaning that the inter-stimulus interval is 500ms. We are going to import epochs of 300ms around the stimulation events (-100 to 200ms). * Right-click on the filtered file "Raw|band|notch" > '''Import in database''': * Check "'''Use events'''" and select "'''2'''", this is the name that brainstorm assigns for the stimulus onset, it may have different name on your computer. Set epoch time: '''[-100, 200]''' '''ms ''' and Apply SSP/ICA in order to apply the average reference.<<BR>><<BR>> {{attachment:importEpochs.jpg||height="500",width="600"}} * At the end, you are asked whether you want to ignore one epoch that is shorter than the others. This happens because the acquisition of the MEG signals was stopped less than 300ms after the last stimulus trigger was sent. Therefore, the last epoch cannot have the full [-100,200]ms time definition. This shorter epoch would prevent us from averaging all the trials easily. As we already have enough repetitions in this experiment (240), we can just ignore it. The total number of epochs is then 239. |
| Line 298: | Line 214: |
| * | * Drag and drop all the Trigger01 trials to the Process1 tab. * Run the process '''Average > Average files''': By trial group (folder average)<<BR>><<BR>> {{attachment:avrgEpochs.jpg||height="500",width="600"}} * Review the average for the '''MEG''' and '''EEG''' as a topography plot: Right-click on the averaged signal > EEG > 2D disc, repeat for MEG.<<BR>><<BR>> {{attachment:megEegTopography.jpg||height="700",width="800"}} * At the selected time (21ms), an ERP is visible with a nice dipolar pattern on the sensors, both for the EEG and MEG. == Forward model == We are going to use the realistic FEM model previously generated from the MRI. Go to the "Anatomy" view, and make sure that the FEM head model is highlighted in green color (it should be the case if you have only one model). You may also highlight the cortex to use for the computation (select the cortex_15002V). You can compute the forward model both for EEG and MEG simultaneously, however, using the high mesh resolution model we recommend to compute separately the head model for each modality (EEG and then MEG). The time required for EEG is around one hour for ~70 channels, for the MEG with 306 sensors it can take up to 4 hours or more (with the integrations points). The EEG/MEG FEM computation depends on the computation of the FEM transfer matrix, which is related to the resolution of the FEM head mesh (number of vertices) and the number of sensors. In most of the case, the number of EEG sensors is lower than the number of MEG sensors. Furthermore, internally the MEG sensors modeling uses the integrations points, which increase the number of computation points (~ multiplied by 4 for the magnetometers and by 8 for the gradiometers). Therefore, the MEG requires more time than the EEG. To reduce the MEG computation time, there are some tips: 1. Use only the inners tissues (wm, gm, and CSF) ==> reduce the number of vertices 1. Do not use the integration points ==> reduce the number of virtual sensors 1. These parameters can be tuned from the DUNEuro options panel (see the advanced panel) === EEG with DTI tensors === * Go back to the "Functional data" view * Right-click on the channel file (folder with imported epochs) > '''Compute head model''' * Select '''EEG only > DUNEuro FEM''', and set the comment to "DUNEuro FEM EEG DTI tensors" * On the DUNEuro options panel: click on "Show details" and set the options as illustrated below * Click OK. Depending on the performance of your computer, the FEM EEG head modeling can last between 30min to 3hrs. Once the computation is done, a new node with the name "DUNEuro FEM EEG DTI tensors" appears in the Brainstorm database navigator, which can be used for the source localization process.<<BR>><<BR>> {{attachment:eegDuneuroPanels.jpg||height="300",width="600"}} === MEG with DTI tensors === * Right-click on the channel file > '''Compute head model''' * Select '''MEG only > DUNEuro FEM''', and set the comment to "DUNEuro FEM MEG DTI tensors" * On the DUNEuro options panel: click on "Show details" and set the options as illustrated below. To reduce the computation time, we select only the inner layers (white, gray and CSF). * Click OK. Depending on the performance of your computer, the FEM MEG head modeling can last between 1hr to 4hrs. Once the computation is done, a new node with the name "DUNEuro FEM MEG DTI tensors" appears in the Brainstorm database navigator, which can be used for the source localization process.<<BR>><<BR>> {{attachment:megDuneuroPanelsDTI.jpg||height="300",width="600"}} === EEG with isotropic conductivity === If the DTIs are not available, it is possible to use the isotropic conductivities instead. In this tutorial, we will compute another forward model in order to compare the sources obtained with anisotropic or isotropic conductivities. * First you need to make sure that the tensors are not computed. If you have the tensors already computed, you need to clear these values. Go to the "Anatomy" view, right-click on the FEM mesh > '''Clear FEM tensors'''. * Go back to "Functional data", right-click on channel file > '''Compute head model'''. In this case, you can change the isotropic conductivity for each tissue. Set the options as in the figure below.<<BR>><<BR>> {{attachment:eegDuneuroPanelsIso.jpg||height="300",width="600"}} === MEG with isotropic conductivity === * Same as before, first you need to make sure that the tensors are not computed. * Right-click on the channel file > '''Compute head model,''' and set the value as in the figure below. In this example keep only the inner tissues (white, gray and CSF).<<BR>><<BR>> {{attachment:megDuneuroPanelsIso.jpg||height="300",width="600"}} |
| Line 301: | Line 260: |
| === Head model === * |
|
| Line 305: | Line 261: |
| * | * We will use the baseline of the single epochs to calculate the noise covariance matrix. * Right-click on the epochs group > Noise covariance > '''Compute from recordings'''. Enter the same baseline interval we used for removing the DC offset: '''[-100, -10] ms''' <<BR>><<BR>> {{attachment:noiseCovariance.jpg||height="300",width="600"}} |
| Line 308: | Line 265: |
| * * * === Regions of interest === * Create two scouts S1 and S2 to represent the primary and secondary somatosensory cortex of the left hemisphere. * |
It is recommended to study separately the two modalities because Brainstorm does not offer any reliable method for combining MEG and EEG source imaging yet. More explanations in the [[https://neuroimage.usc.edu/brainstorm/Tutorials/SourceEstimation#Combining_MEG.2B-EEG_for_source_estimation|Source estimation tutorial]]. * Repeat the same step for each of the four forward models (EEG/MEG, DTI/isotropic): * Right-click on the head model > '''Compute sources''' > '''Dipole modeling'''. * Edit the comment to be able to identify the source maps easily: EEG FEM DTI, EEG FEM ISO, MEG FEM DTI, MEG FEM ISO.<<BR>><<BR>> {{attachment:computeDipolesInverseAll.jpg||height="300",width="600"}} * For each forward model, this operation creates a shared inversion kernel and one source link for each block of recordings in the folder.<<BR>><<BR>> {{attachment:sharedKernelDipolesEegMeg.jpg||height="300",width="600"}} === Dipole scanning === * Drag and drop the source links for the average in the Process1 tab. * Run the process: Sources > '''Dipole Scanning''' > '''40ms-60ms'''. See the [[https://neuroimage.usc.edu/brainstorm/Tutorials/TutDipScan#Dipole_scanning|Dipole scanning tutorial]]. <<BR>><<BR>> {{attachment:dipoleScanningProcess.jpg||height="300",width="600"}} * Select and merge the MEG ISO and the MEG DTI dipoles. Repeat for the EEG dipoles. * Rename the merged dipoles with a clearer comment, as illustrated below.<<BR>><<BR>> {{attachment:dipolesMergeEEG&MEG.jpg|dipolesMergeEEG&MEG.jpg|height="300",width="600"}} === Comparison: DTI vs isotropic === The following figures (left EEG, right MEG), show the localization of the dipoles on the MRI at the 21ms. The ISO model is colored in green whereas the DTI model is colored in red. {{attachment:eegMegDipolesSagittal.jpg||height="300",width="600"}} {{attachment:eegMegDipolesAxial.jpg||height="300",width="600"}} {{attachment:eegMegDipolesCoronal.jpg||height="300",width="600"}} In this experiment, the anisotropy does not show a significant effect on the source localization, whereas it shows a slight difference in the orientation. === Comparison: MEG vs EEG === When we compare between the EEG and the MEG, there is a difference of 20mm between the localization between the MEG and the EEG as well as a difference in the orientation in the coronal view. If we compare the difference between the EEG and MEG dipoles, the following figures (left anisotropy, right isotropic), show the localization of the dipoles on the MRI at the 21ms. The EEG dipole is colored in green whereas the MEG dipole is colored in red. {{attachment:eegMegDipolesSagittal2.jpg||height="300",width="600"}} {{attachment:eegMegDipolesAxial2.jpg||height="300",width="600"}} {{attachment:eegMegDipolesCoronal2.jpg||height="300",width="600"}} Aniso: Eeg [-7.5 -35.7 89.8] vs Meg [-0.2 -33.6 88.6] ==> '''distance = 7.7mm ''' Iso: Eeg [-7.5 -35.7 89.8] vs Meg [-0.2 -33.6 88.6] ==> '''distance = 7.7mm ''' In both modalities, the dipoles are located exactly in the same positions, and there is 7.7mm between the two dipoles. Furthermore, we notice a difference on the orientation on the coronal and sagittal views === Comparison: FEM vs BEM/OS === We will now compare qualitatively the FEM results with the default methods implemented in Brainstorm: Overlapping spheres for MEG, BEM for EEG. * Right-click on the channel file > '''Compute head model''' > '''MEG: Overlapping spheres''' * Right-click on the channel file > '''Compute head model''' > '''EEG: OpenMEEG BEM''' * Repeat the same source localization procedure: '''Compute sources''' and '''Dipole scanning'''. In the following figures, left is the dipoles computed from the EEG (BEM in red and FEM in green), right are the dipoles computed from the MEG (OS in red and FEM in green) {{attachment:eegMegDipolesSagittal3.jpg||height="300",width="600"}} {{attachment:eegMegDipolesAxial3.jpg||height="300",width="600"}} {{attachment:eegMegDipolesCoronal3.jpg||height="300",width="600"}} EEG: fem [-7.5 -35.7 89.8] ; bem [-10.7 -35.0 89.5] ==> '''3.3mm''' MEG: fem [-0.2 -33.6 88.6] ; os [-10.7 -39.3 83.2] ==> '''13.1 mm''' As expected, the slight difference on the localization can be explained by the difference on the head shape, the conductivity values as well as the resolution method. <<TAG(Advanced)>> == Additional documentation == ==== Related tutorials ==== * [[https://neuroimage.usc.edu/brainstorm/Tutorials/Duneuro|Realistic head model: FEM with DUNEuro]] * [[https://neuroimage.usc.edu/brainstorm/Tutorials/FemMesh|FEM mesh generation]] * [[https://neuroimage.usc.edu/brainstorm/Tutorials/FemTensors|FEM tensors estimation]] ==== Articles ==== * Medani T, Garcia-Prieto J, Tadel F, Schrader S, Joshi A, Engwer C, Wolters CH, Mosher JC, Leahy RM, [[https://www.spiedigitallibrary.org/conference-proceedings-of-spie/11595/1159554/Realistic-head-modeling-of-electromagnetic-brain-activity--an-integrated/10.1117/12.2580935.short?SSO=1|Realistic head modeling of electromagnetic brain activity: An integrated Brainstorm pipeline from MRI data to the FEM solution]] ([[http://arxiv.org/abs/2011.01292|preprint]]), '''SPIE Medical Imaging''', Feb 2021 |
| Line 317: | Line 329: |
| The following script from the Brainstorm distribution reproduces the analysis presented in this tutorial page: [[https://github.com/brainstorm-tools/brainstorm3/blob/master/toolbox/script/tutorial_fem.m|brainstorm3/toolbox/script/tutorial_fem.m]] <<HTML(<div style="border:1px solid black; background-color:#EEEEFF; width:720px; height:500px; overflow:scroll; padding:10px; font-family: Consolas,Menlo,Monaco,Lucida Console,Liberation Mono,DejaVu Sans Mono,Bitstream Vera Sans Mono,Courier New,monospace,sans-serif; font-size: 13px; white-space: pre;">)>><<EmbedContent("https://neuroimage.usc.edu/bst/viewcode.php?f=tutorial_fem.m")>><<HTML(</div >)>> <<EmbedContent(https://neuroimage.usc.edu/bst/get_feedback.php?Tutorials/FemMedianNerve)>> |
[TUTORIAL UNDER CONSTRUCTION: NOT READY FOR PUBLIC USE]
FEM tutorial: MEG/EEG Median nerve stimulation
Authors: Takfarinas Medani, Juan Garcia-Prieto, Wayne Mead, Michael Funke, Francois Tadel
This tutorial introduces the most advanced FEM modeling options available in the Brainstorm environment, applied to MEG+EEG recordings of a median nerve stimulation. The pipeline presented here includes: FEM mesh reconstruction with SimNIBS/CAT12, FEM head model including DTI tensors for modeling anisotropic conductivities (using BrainSuite), FEM forward model estimation with DUNEuro. This pipeline requires many third-party programs and very long computation times. For a simpler FEM pipeline, please refer to the tutorial: Realistic head model: FEM with DUNEuro.
Note that the operations used here are not detailed, the goal of this tutorial is not to introduce Brainstorm to new users. For in-depth explanations of the interface and theoretical foundations, please refer to the introduction tutorials.
Contents
Dataset description
Experiment
The experiment consists of an unilateral median nerve stimulation conducted in a MEG laboratory with an Elekta Triux (Megin, Finland) scanner.
- The stimulation signal was a square-wave pulse with 2Hz frequency and duration of 0.2ms.
- An ISI (inter-stimulus interval) of 500ms with a variation of ±20ms in order to be able to average out time-locked noise to the stimulation, while remaining unnoticeable by the subject.
- The stimulation was performed on the left hand/wrist, for two minutes, with a Digitimer DS7A stimulator. An electrode was placed on the hand/wrist while current value was tuned to match the motor threshold of the subject on the stimulated hand, with a result of 10~12mA approximately.
- Recordings were performed with a 1kHz sampling rate. Continuous HPI was disabled during these recordings. High-pass filters were set to DC for MEG channels and 0.03Hz for EEG channels.
All MEG files underwent a MaxFilter (version 2.3.13) tsss post-processing.
MRI imaging scanning (Philips Medical Systems):
- T1w image without contrast: 3T field strength, flip angle 8°, TR 7.9s, dimensions 512 × 512 × 200, and voxel dimensions of 0.469 × 0.469 × 0.939 millimeters
- T2w spin-echo image: 3T field strength, 78.57% phase FOV, 90° flip angle, SAR 0.327, voxel dimensions 560 × 560 × 55, dimensions of 0.429 × 0.429 × 3 millimeters
- DWI sequences: voxel dimensions 512 x 512 x 200 and dimensions of 0.469 × 0.469 × 0.939 millimeters, diffusion-sensitizing gradients in 32 non-collinear directions
Files
The dataset we distribute with this tutorial follows the Brain Imaging Data Structure (BIDS) standard for neuroimaging data organization. The files that will be imported in this tutorial are the following:
sample_fem/sub-fem01/: Raw data for subject fem01
ses-meg/: Simultaneous recordings of MEG and EEG.
sub-fem01_ses-meg_task-mediannerve_run-01_proc-tsss_meg.fif
ses-mri/: Imaging exams.
anat/sub-fem01_ses-mri_T1w.nii.gz: T1-weighted MRI
anat/sub-fem01_ses-mri_T2w.nii.gz: T2-weighted MRI
dwi/sub-fem01_ses-mri_dwi.*: Diffusion-Weighted Imaging (DWI)
License
Creative Commons CC0 1.0 Universal. This dataset is distributed in the public domain.
Download and installation
Requirements
- You have already followed all the introduction tutorials.
- You have a working copy of Brainstorm installed on your computer.
Additional programs
You need to install the following programs (listed by order of appearance):
SimNIBS: See tutorial: FEM mesh generation
BrainSuite: See tutorial: FEM tensors estimation
MATLAB Runtime: Follow the instructions on the BrainSuite download page
SPM12: Install as Brainstorm plugins
CAT12: Install as Brainstorm plugins
Iso2mesh: Install as Brainstorm plugins
DUNEuro: See tutorial: Realistic head model: FEM with DUNEuro
Download the dataset
Go to the Download page and get the file: sample_fem.zip
- Unzip it outside of any of the Brainstorm folders (program folder or database folder).
- Start Brainstorm (Matlab scripts or stand-alone version)
Select the menu File > Create new protocol. Name it "TutorialFem" and select:
- No, use individual anatomy
- No, use one channel file per condition
Import the anatomy
T1 MRI
- Switch to the "anatomical data" view, the left button in the toolbar above the database explorer.
Right-click on the TutorialFem folder > New subject > Subject01
- Keep the default options you set for the protocol.
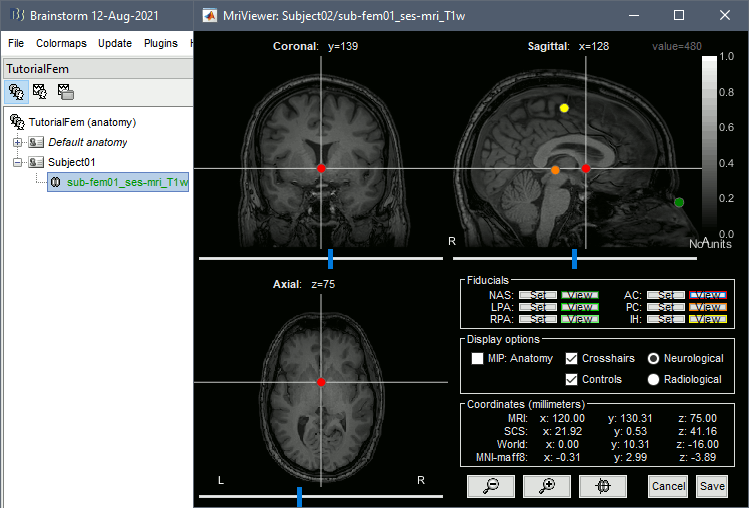
Right-click on the subject node > Import MRI:
Set the file format: All MRI files (subject space)
Select the T1 file: sub-fem01/ses-mri/anat/sub-fem01_ses-mri_T1w.nii.gz
Click on the link "Click here to compute MNI normalization": option "maff8".
This estimates an affine transformation to the MNI space and sets default positions for the anatomical fiducials. Because we will use the digitized head shape of the subject to refine the MRI/MEG registration, we don't need the position of the fiducials to be very accurate.
T2 MRI
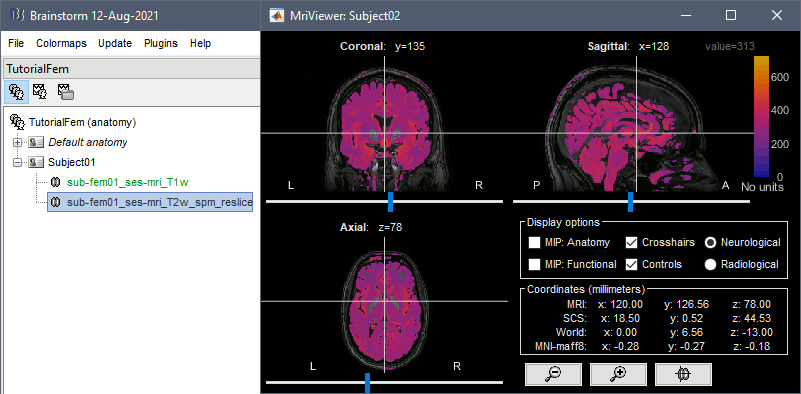
Right-click on the subject node > Import MRI:
Set the file format: All MRI files (subject space)
Select the T2 file: sub-fem01/ses-mri/anat/sub-fem01_ses-mri_T2w.nii.gz
- Brainstorm asks about registering the new T2 with the reference T1 image:
Select the option: SPM
Reslice the volume: Yes
This process will take few minutes, just be patient.
Diffusion imaging
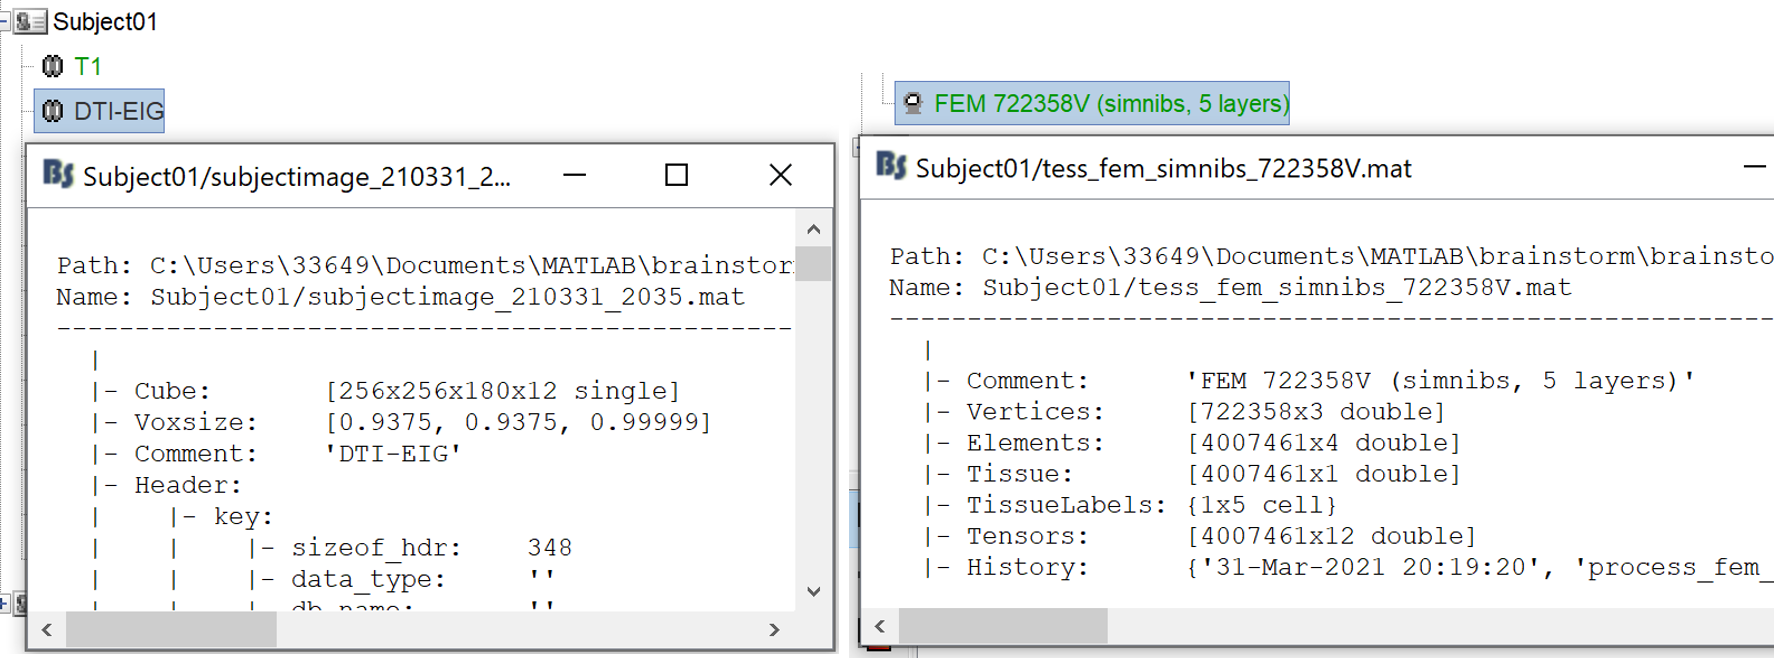
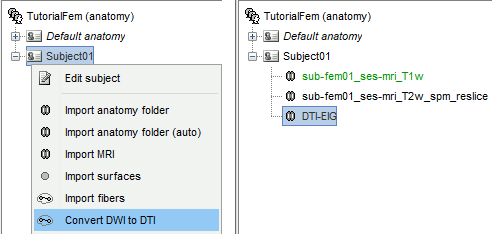
The FEM has the ability to incorporate anisotropic conductivity from MRI diffusion imaging, which is particularly interesting for the modeling of the white matter. Brainstorm can load the Diffusion-Weighted Images (DWI), and compute the tensors (DTI) using the BrainSuite Diffusion Pipeline (BDP). This requires BrainSuite to be installed on your computer, with the bdp program available in the system path.
Right-click on Subject01 > Convert DWI to DTI
Select the DWI file: sub-fem01/ses-mri/dwi/sub-fem01_ses-mri_dwi.nii.gz
- The associated files *dwi.bvec and *dwi.bval must be in the same folder.
The process can take up to 30min. At the end, a new file DTI-EIG appears in the database. This file contains 12 volumes, ie. 12 values for each voxel. From 1 to 9: components of the three eigenvectors; from 10 to 12: the values of their norm to the eigenvalue.
FEM head model
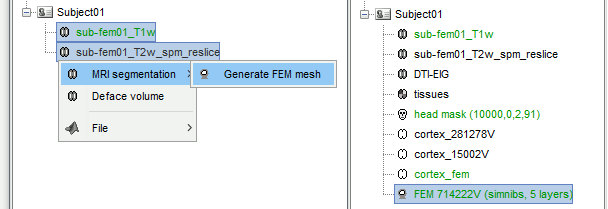
The FEM approach requires a segmentation of the head volume in different tissues, represented as hexahedral or tetrahedral 3D meshes. The methods available within Brainstorm are listed in the tutorial FEM mesh generation. Here we illustrate only the use of SimNIBS.
FEM mesh with SimNIBS
Running SimNIBS:
- Select both the T1 and the T2 MRIs, using the mouse and the SHIFT or CTRL keys.
Right-click on the selected files > MRI segmentation > Generate FEM mesh > SimNIBS. Keep the default options.
- This process can take 2-5 hours.
- The output of SimNIBS is saved in the temporary folder $HOME/.brainstorm/tmp/simnibs, and then imported into the Brainstorm database.
At the end of this computation, new files are available in the database:
tissues: Segmentation of the head volume in 6 different tissues
head mask: Outer surface of the scalp
cortex_280000V: Pial surface generated by CAT12 within the SimNIBS process
cortex_15002V: Low-resolution version of the pial surface
cortex_fem: Outer surface mesh of the gray matter, extracted from the FEM mes
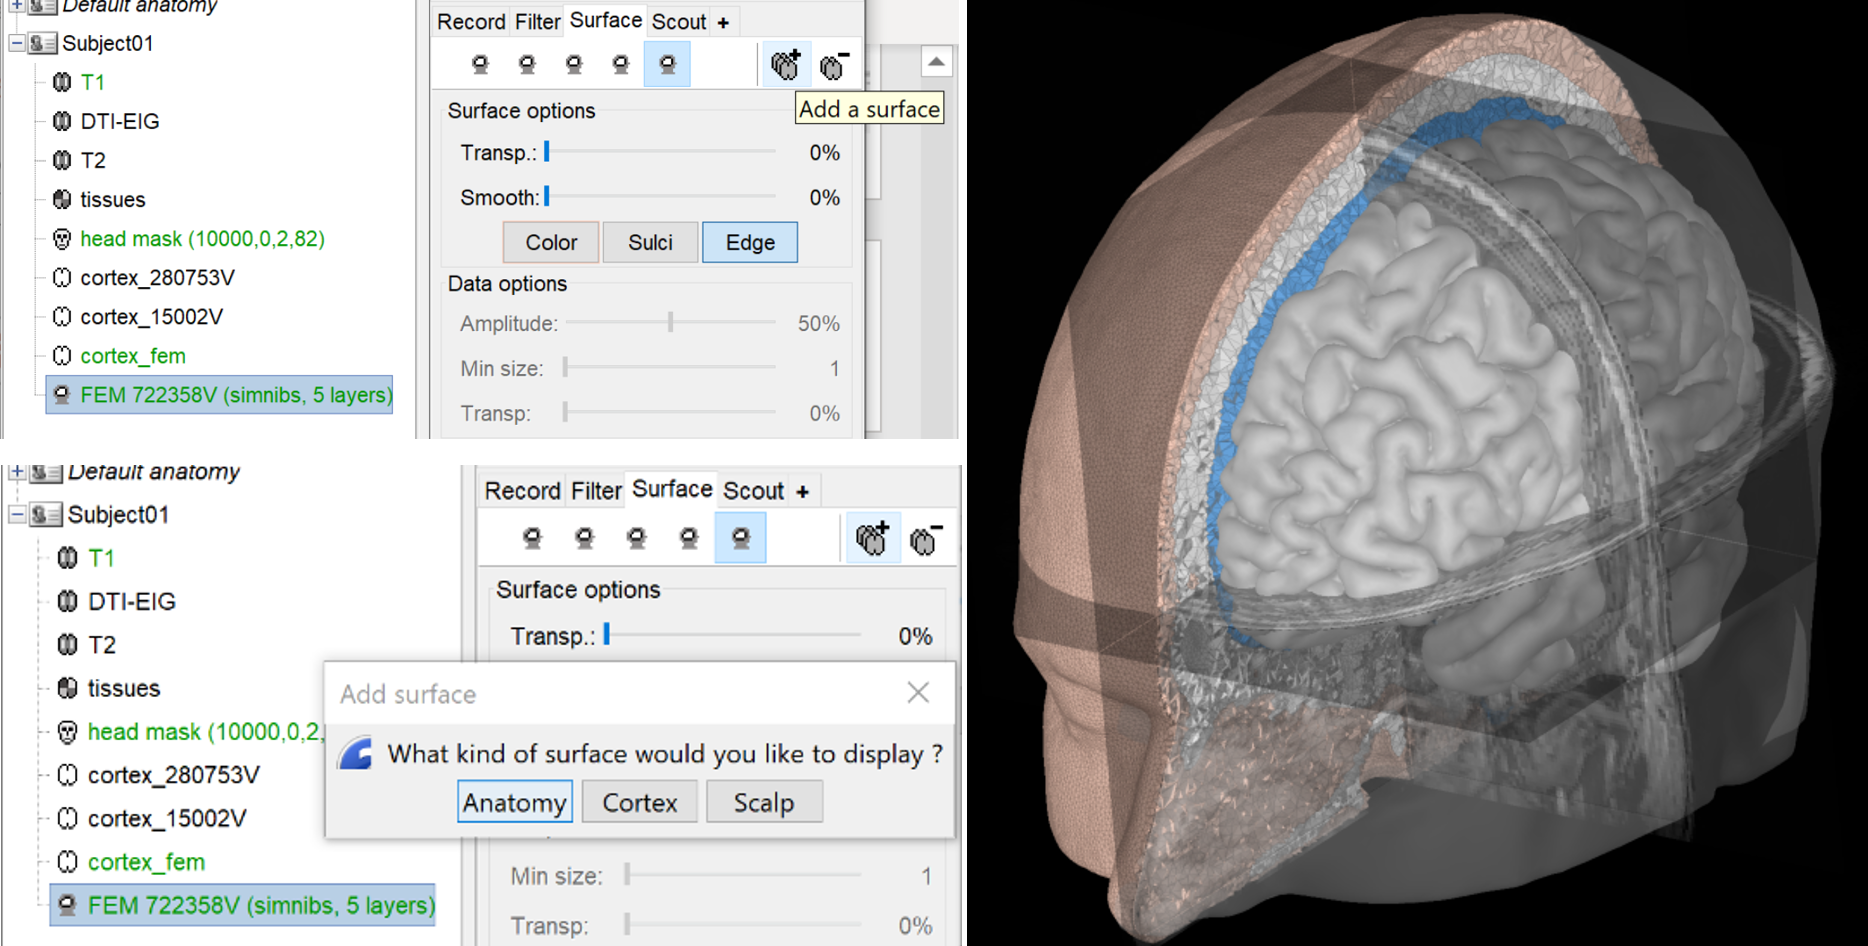
FEM 70000V: Tetrahedral FEM mesh with 5 layers (gm, wm, CSF, skull, scalp).
At the end of the process, make sure that the file "cortex_15002V" is selected (downsampled pial surface, which will be used for the source estimation). If it is not, double-click on it to select it as the default cortex surface.
Remesh with Iso2mesh
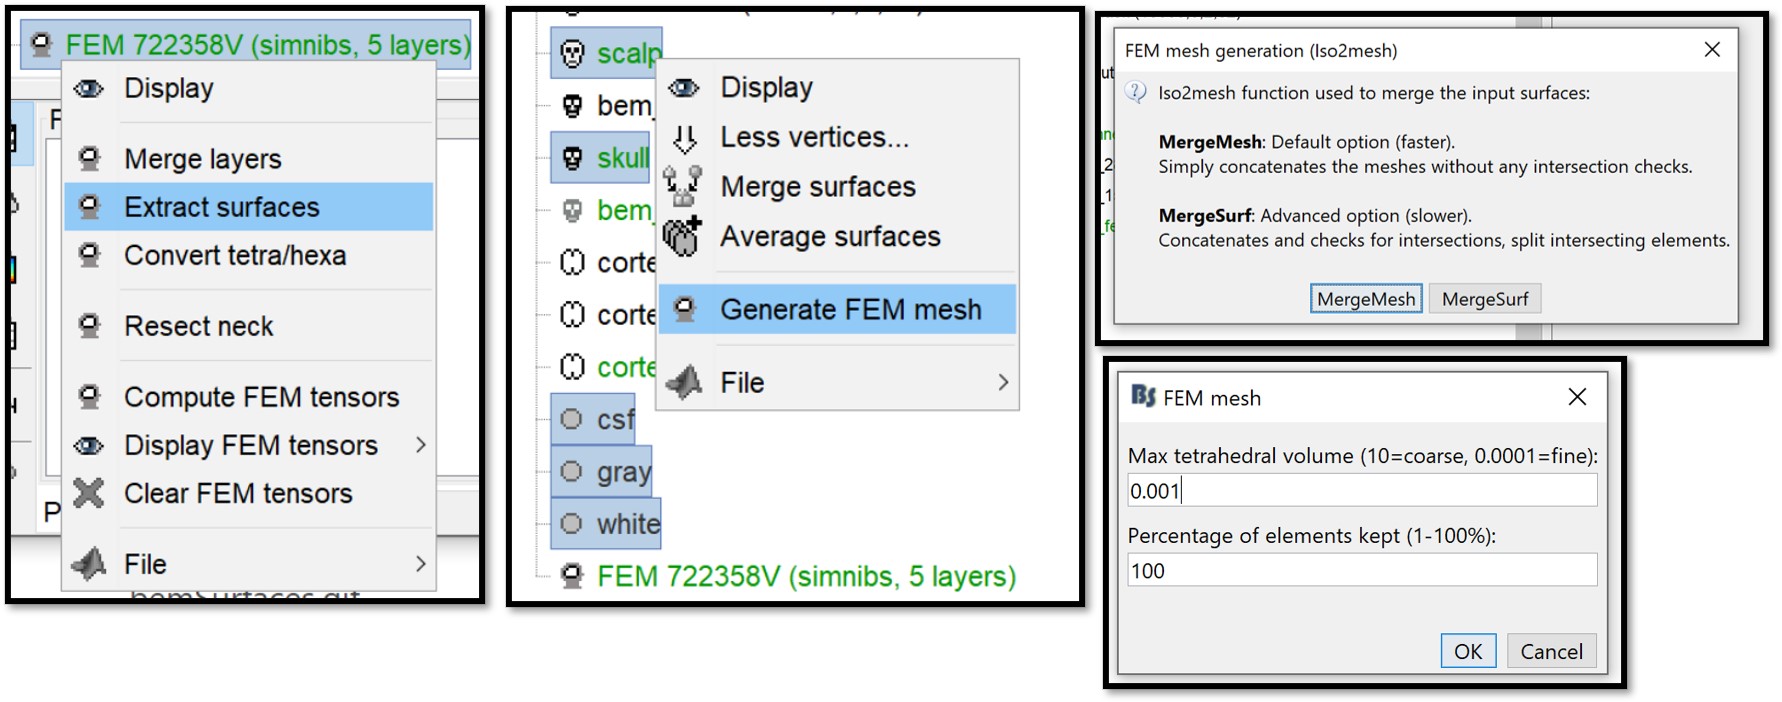
In some cases, the FEM mesh generated with SimNibs causes issues with the DUNEuro FEM solver, due to the air cavities that are not tesselated. In order to avoid these possible issues in the next steps, we will correct the mesh using the Iso2mesh functions integrated within Brainstorm.
Right-click on the FEM mesh > Extract surfaces.
- Hold the CTRL key to select all the extracted surfaces (white, gray, csf, skull, scalp).
Right-click > Generate FEM mesh > Iso2mesh-2021 > MergeMesh > Max volume = 0.001, Percentage kept = 100. Note that the higher the resolution leads to higher accuracy but also higher memory requirements and longer computation times.
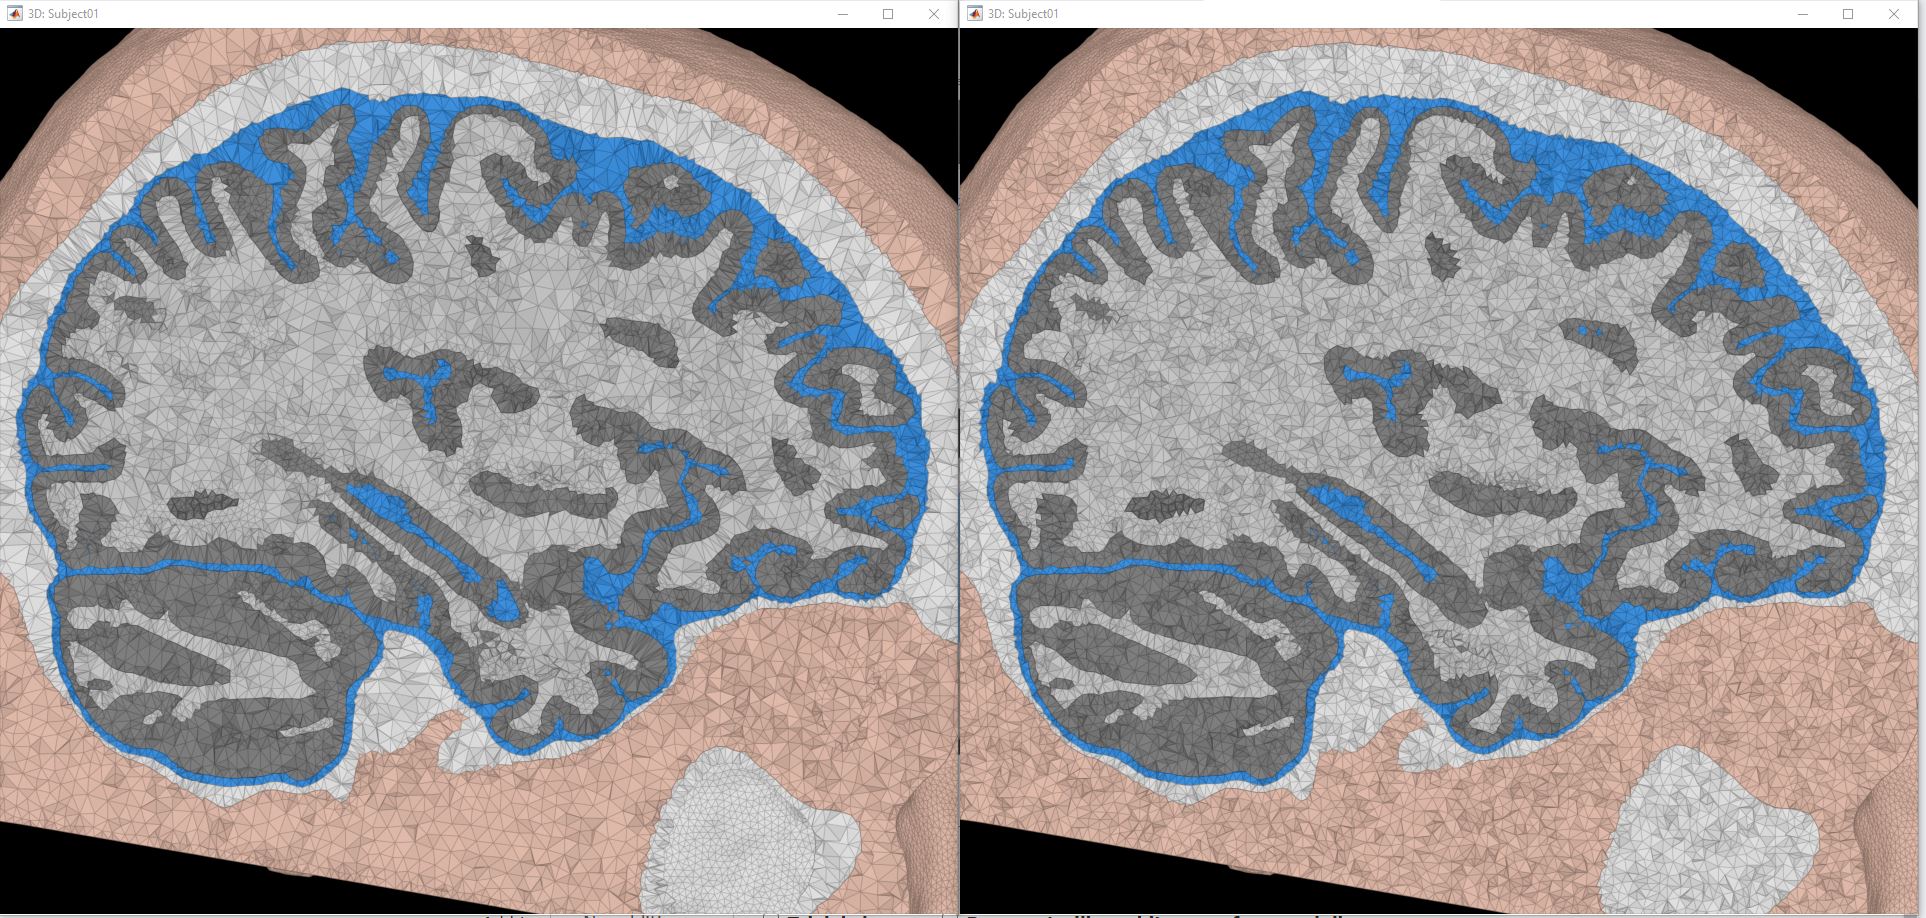
The following figure shows the two model, left is the initial model obtained with SimNibs, right is the second model obtained from the Iso2Mesh remesh: the air cavity in the bottom-right corner is now fully tesselated. Note that you can also use this process to generate FEM models with higher mesh densities.
FEM tensors
We can now incorporate the diffusion information into the FEM model, and compute anisotropic conductivity tensors for the tetrahedral elements of the white matter (we consider the other tissues to have isotropic conductivities).
Right-click on the FEM mesh > Compute FEM tensors. Select the options as illustrated below, and refer to the tutorial FEM tensors for more information.
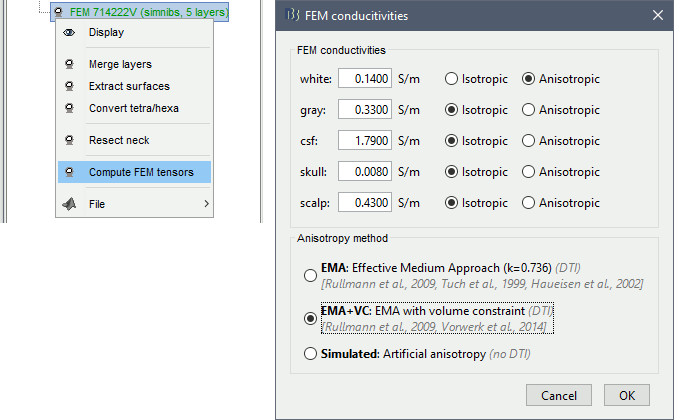
- This process can take up to 5min, depending on the resolution of the FEM mesh.
Visualization
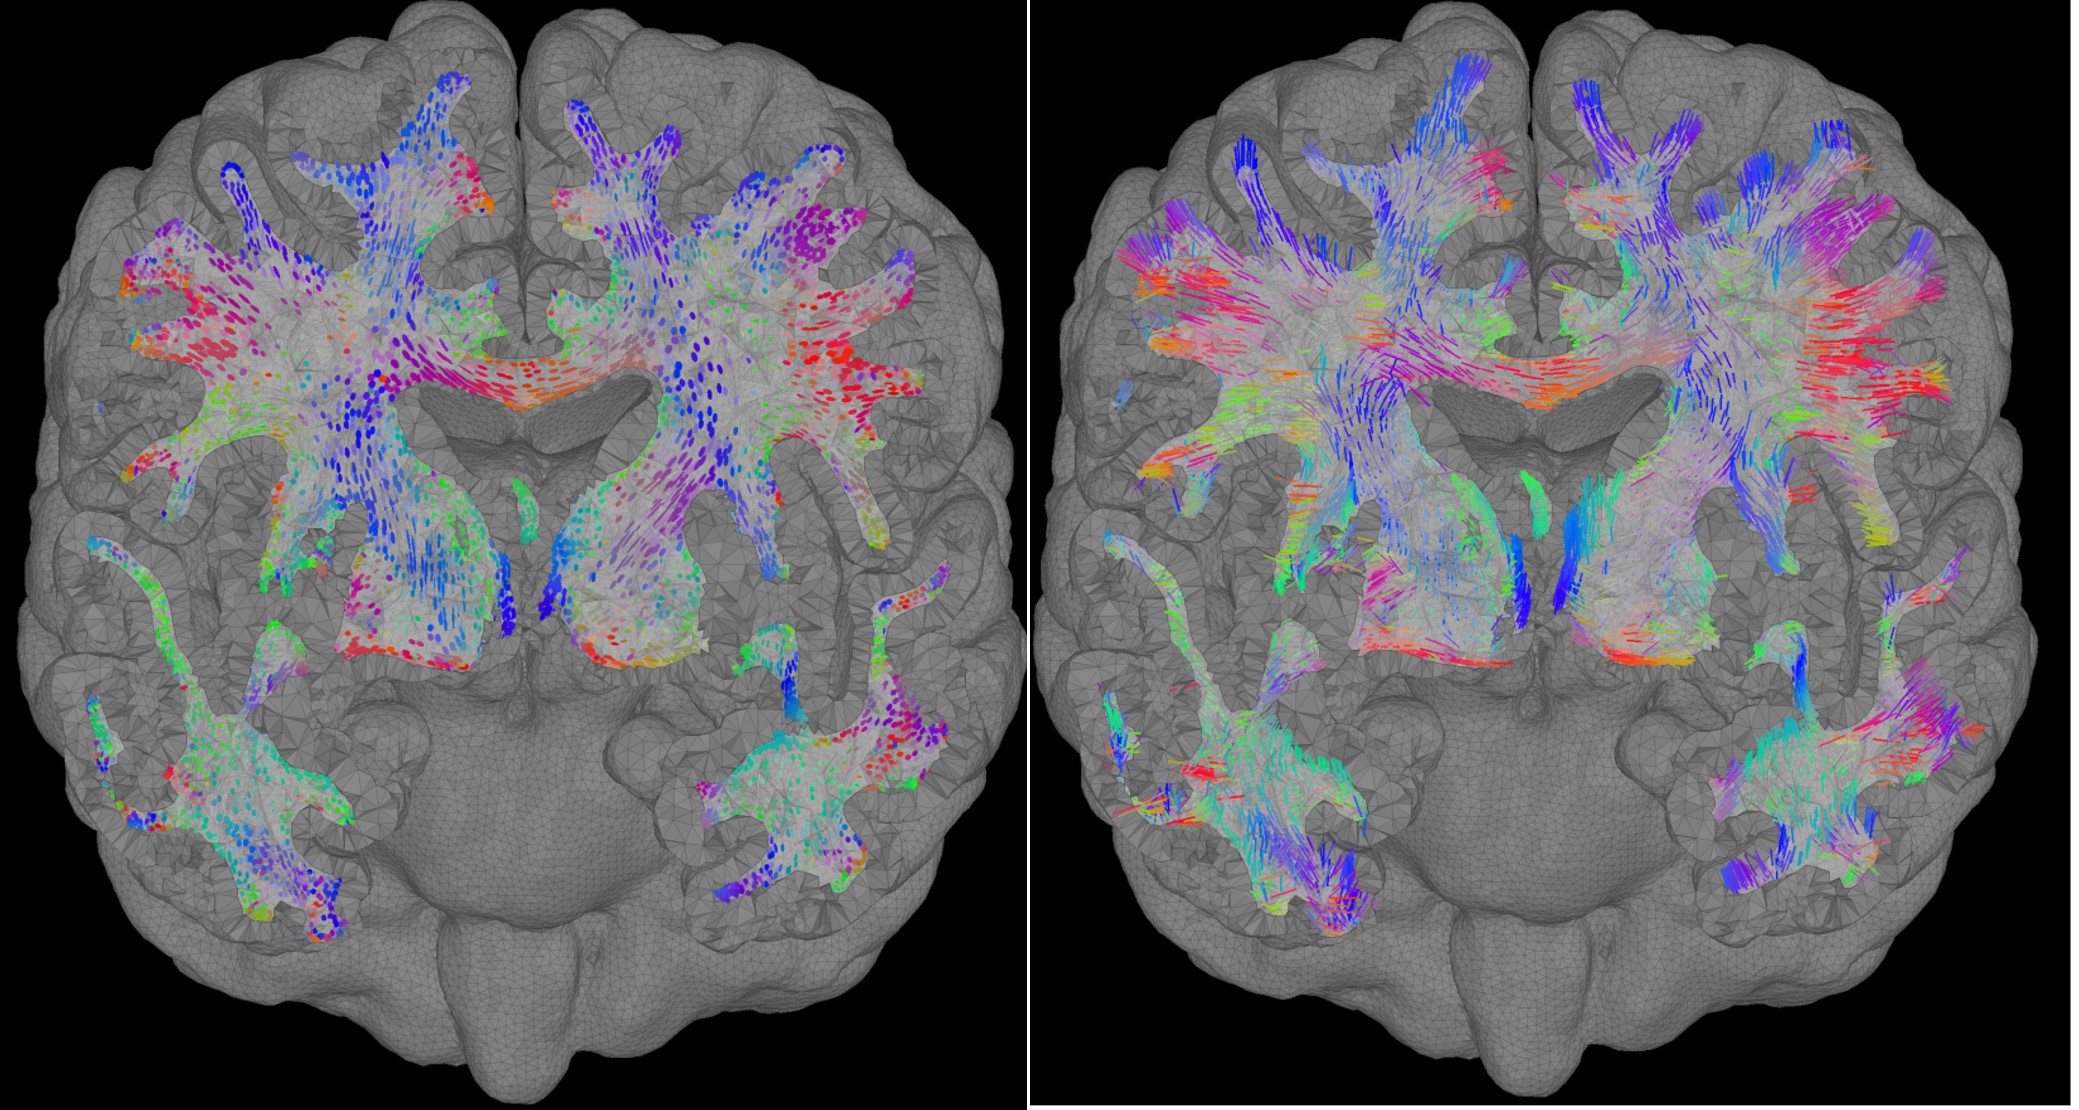
Brainstorms include the possibilities to display the FEM head models and the tensors, users can also overlay the display with the MRI as well as with the different surfaces.
Right-click on the FEM mesh > Display FEM tensors: The FEM tensors can be displayed on the mesh or MRI, as arrows on the main eigenvector or as ellipsoids on each FEM element.

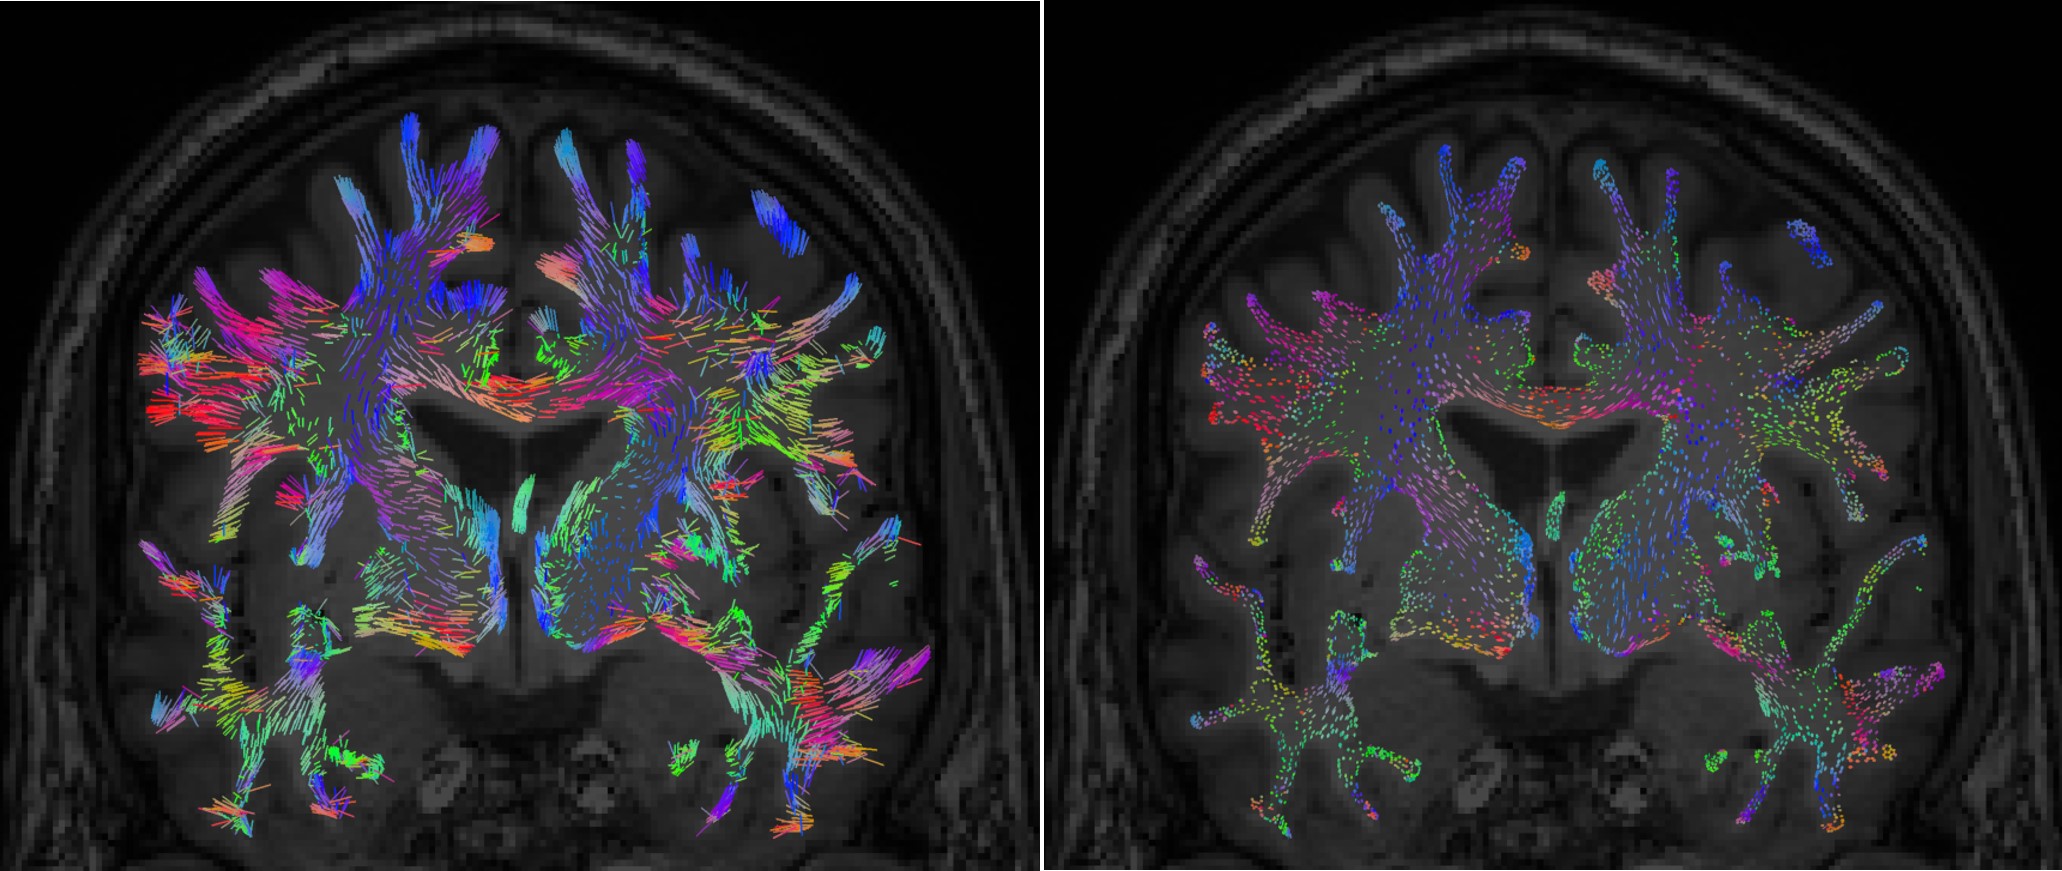
To configure the display: right-click on the figure > FEM tensors menu. The keyboard shortcuts for changing the size of the displayed tensors are the Up and Down arrows keys. You can also switch the display mode by using the shortcut "Shift + Space".
On the hard drive
The DTI-EIG file as the same structure as any MRI file, with 12 volumes stacked along the 4th dimension. From 1 to 9: components of the three eigenvectors; from 10 to 12: the values of their norm to the eigenvalue.
The FEM mesh contains the following fields:
BEM head model
For the purpose of comparison between the FEM and the BEM, we will generate also the BEM surfaces for this subject and we will follow the same step as explained in the BEM tutorial.
Right-click on Subject01 > MRI segmentation > Generate BEM surfaces > Brainstorm.
Keep the default options: 1922 vertices for all the layers, skull thickness = 4m.- Three new files appear in the database explorer: bem_head_1922V, bem_outerskull_1922V, and bem_innerskull_1922V. These surfaces will be used for the BEM forward computation.
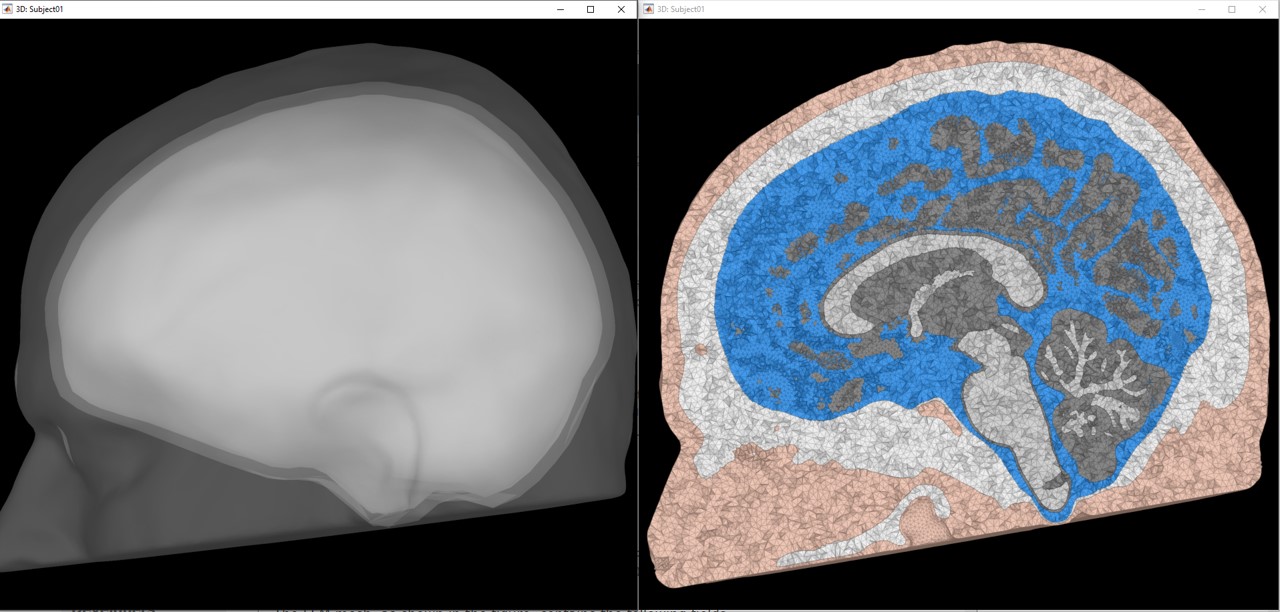
Now we have two head geometry available for this subject, BEM and FEM
Access the recordings
Link the recordings
- Switch to the "functional data" view, the middle button in the toolbar above the database explorer.
The folder "eeg_positions" which contains default 10-10 EEG electrodes positions, was generated by the SimNIBS process. We will not use it in this tutorial: delete this folder.
Right-click on the subject folder > Review raw file:
- Select file type: MEG/EEG: Electa-Neuromag(*.fif)
Select file: sub-fem01/ses-meg/meg/sub-fem01_ses-meg_task-mediannerve_run-01_proc-tsss_meg.fif
FIF event file: Select Event Channel, this will read the events markers
Refine registration? YES
A figure is opened to show the registration MRI/MEG.
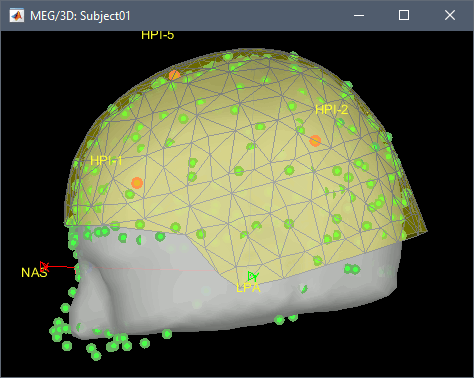
- The new file "Link to raw file" lets you access directly the contents of the MEG/EEG recordings. The "Neuromag channels (374)" contains the name of the channels and the position of the corresponding sensors (MEG/EEG).
Channel file
- The recordings contain signals coming from different types of electrodes:
- 306 MEG channels (102 magnetometers and 204 gradiometers )
- 64 EEG channels
- 2 EOG channels: EO1 and EO2
- 1 Stim channel that contain the stimulation signals
Right-click on the channel file > MRI registration > Edit... (EEG)
- The white points are the electrodes, the green points are the additional digitized head points. To display the label of the electrodes, click on the [LABEL] button in the toolbar. To see what the other buttons in the toolbar are doing and how to use them, leave your mouse over them for a few seconds and read the description.
- The automatic registration based on the head points is already good, therefore we won't apply any additional rotation+translation to the MEG+EEG sensors.
Click on the button "Project electrodes on scalp surface", it will help for the source modeling later. The green points (digitized) stay in place, the white points (electrodes) are now projected on the skin of the subject.
- If you feel like you didn't do this correctly, close the figure and cancel the modifications, then try again.
Click on [OK] when done. Answer YES to save the modifications.
Pre-processing
- Drag and drop the "Link to raw file" into the Process1 list.
Select the process "Frequency > Power spectrum density", configure it as in the figure
After the computation, double-click on the new PSD file to display it.
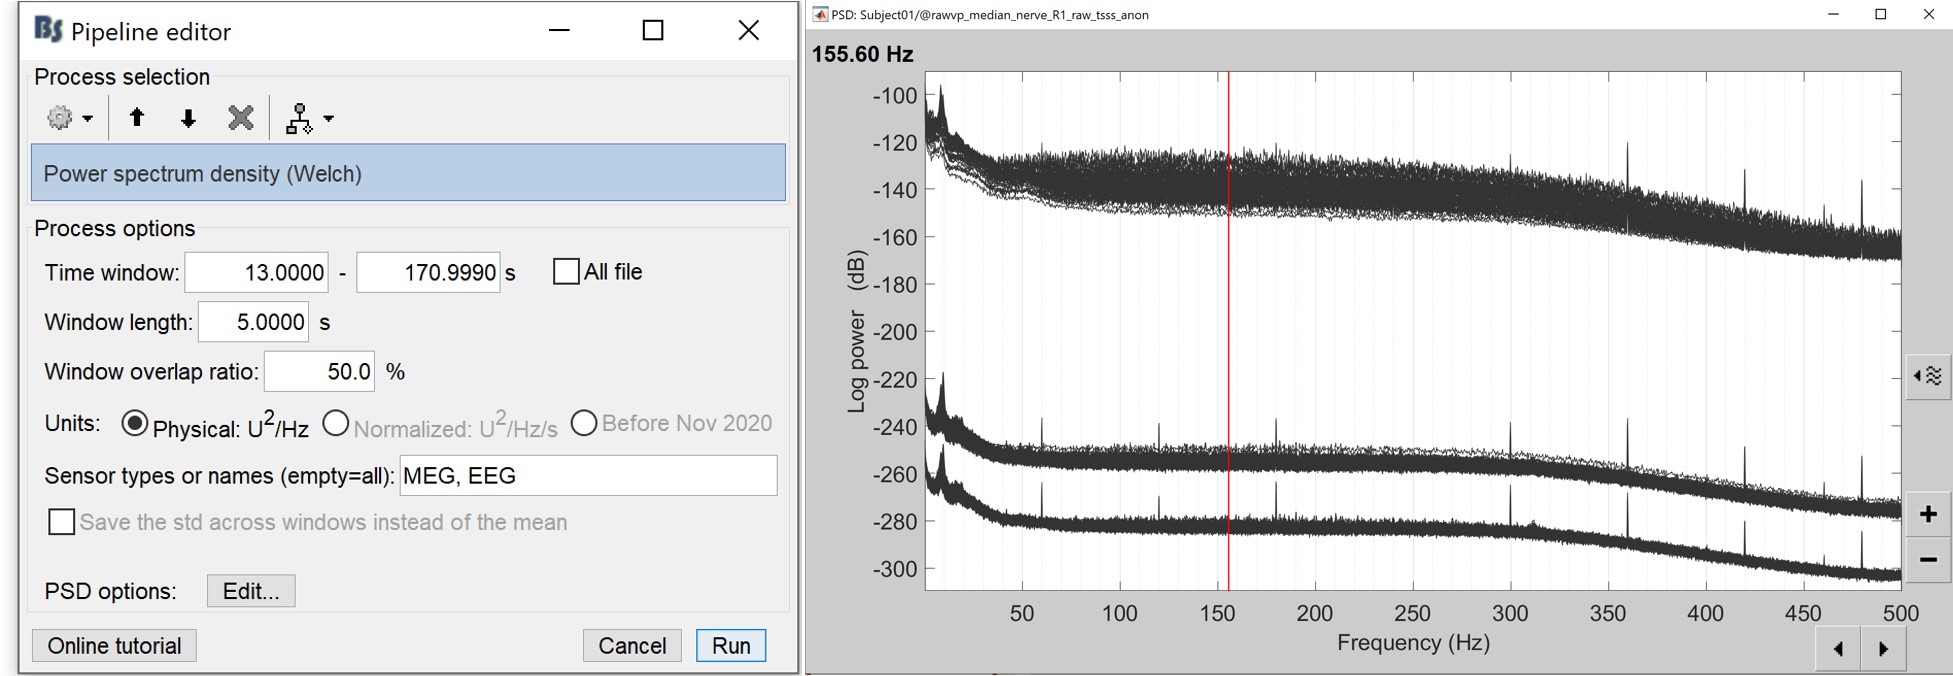
- The lines on the top represent the EEG electrodes, the lines at the bottom the MEG sensors(MAG and GRAD). If you want to get clearer plots, you can calculate separately the spectrum for the two types of sensors separately, by running twice the process "Power spectrum density", once with sensor types = "MEG" and once with "EEG", instead of running in on both at the same time as we did.
- Observations (below 250Hz):
- Peak around 10Hz: Alpha waves from the subject's brain
- Peaks at 60Hz, 120Hz, 180Hz, 240Hz on EEG + MEG: Power lines (60Hz+harmonics)
- Most of the signal looks clean and no bad channel is observed
- If we review quickly the EEG and EOG signals, we notice that they are quite clean and no artifacts are observed. The experiment is well designed and the subject was not moving the eyes (blinks and slow movements), maybe because there was a fixation cross for this experiment. However, we will apply at least a high-pass filter to make the signals easier to process (we are not interested in very low frequencies in this experiment).
Frequency filters
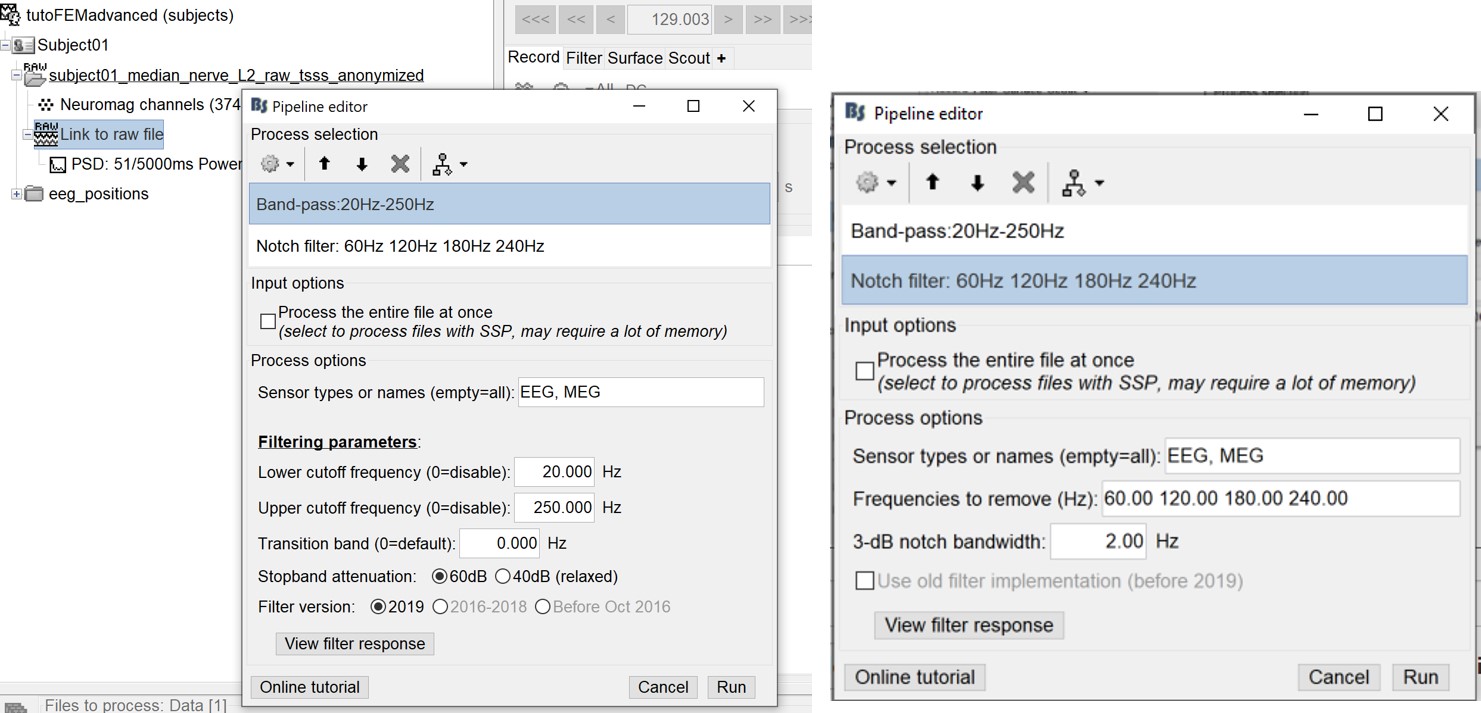
- In Process1, select the "Link to raw file".
Select process Pre-process > Band-pass filter: Frequency=[20, 250]Hz, Sensors=MEG,EEG
Add process Pre-process > Notch filter: Frequencies=[60 120 180]Hz, Sensors=MEG,EEG
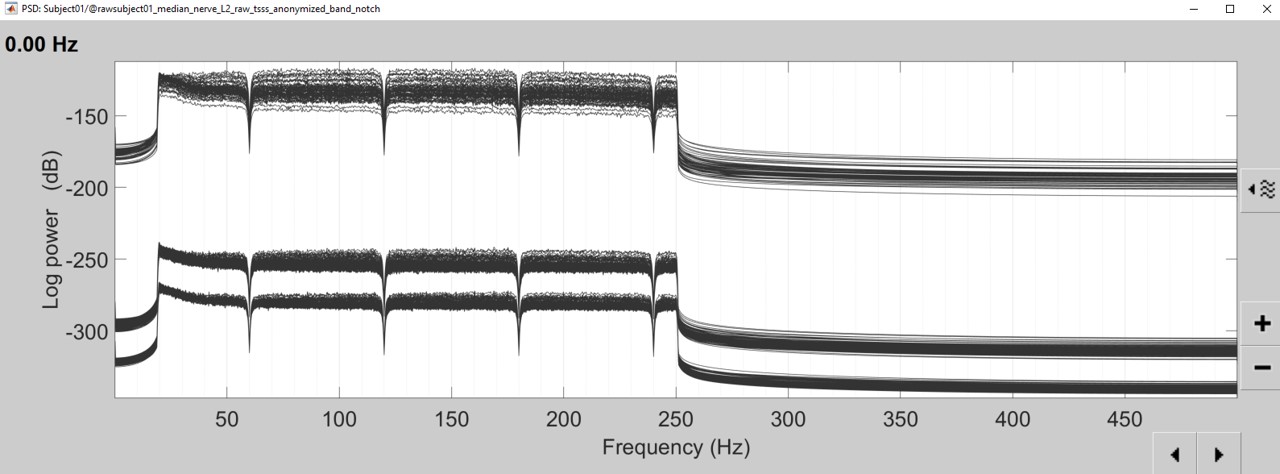
- In Process1, select the filtered file "Raw | Band | Notch".
Run the process "Frequency > Power spectrum density", with the same options as before. And compare with the previous figure. You may find that the power line frequency and its harmonics are removed and the data is filtered between 20 and 250Hz.
- To keep the interface clean and easy to follow: keep only the last continuous file (Raw|Band|Notch). Delete the link to the original file (which will not delete the original .fif file), and delete the "Raw|Band" file.
EEG: Average reference
Right-click on the filtered file "Raw|band|notch" > EEG > Display time series.
In the Record tab, menu Artifacts > Re-reference EEG > "AVERAGE".
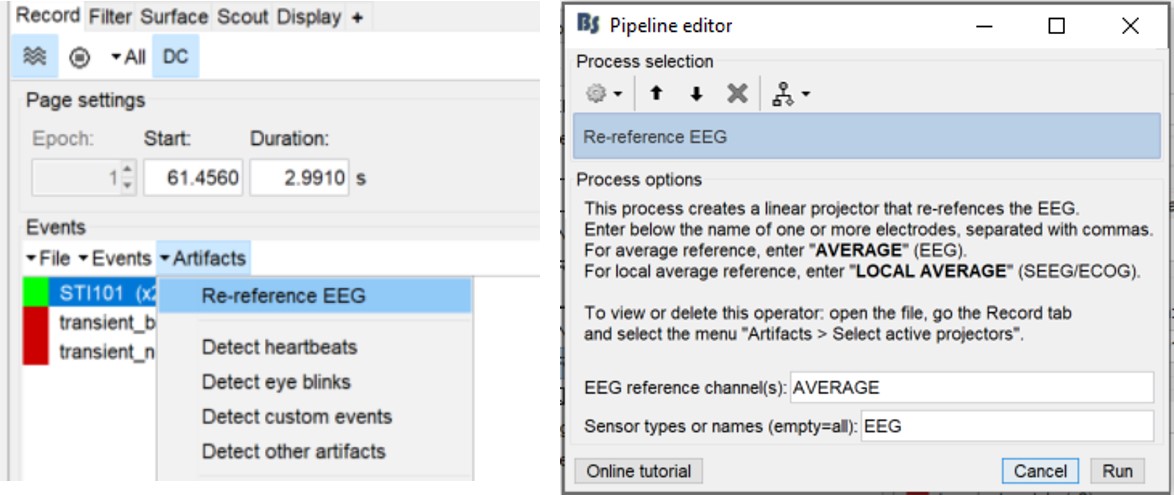
At the end, the window "Select active projectors" is open to show the new re-referencing projector. Just close this window. To get it back, use the menu Artifacts > Select active projectors.
Epoching
In this experiment, the electric stimulation is sent with a frequency of 2Hz, meaning that the inter-stimulus interval is 500ms. We are going to import epochs of 300ms around the stimulation events (-100 to 200ms).
Right-click on the filtered file "Raw|band|notch" > Import in database:
Check "Use events" and select "2", this is the name that brainstorm assigns for the stimulus onset, it may have different name on your computer. Set epoch time: [-100, 200] ms and Apply SSP/ICA in order to apply the average reference.
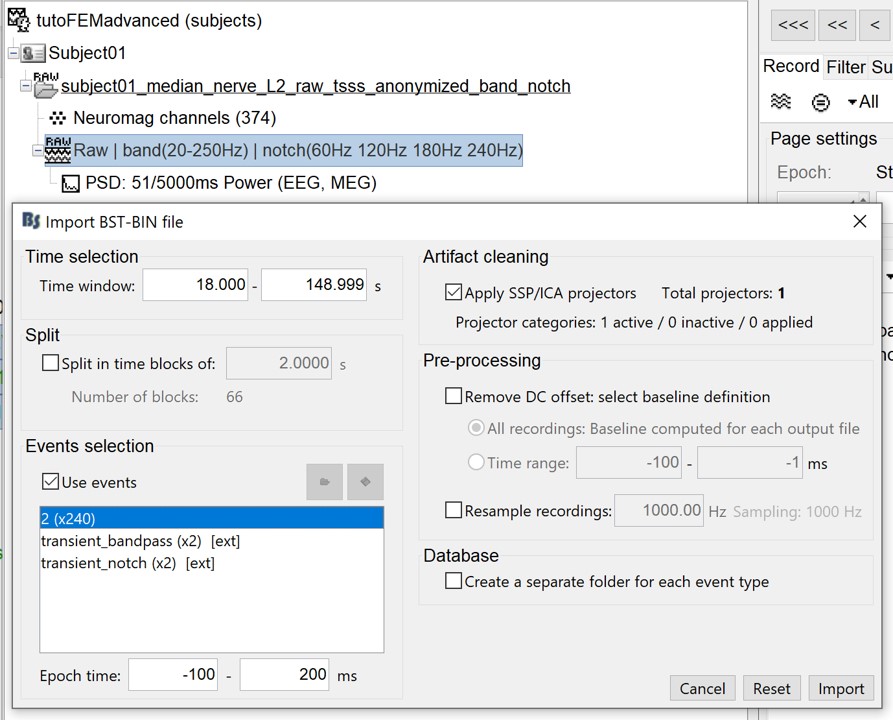
- At the end, you are asked whether you want to ignore one epoch that is shorter than the others. This happens because the acquisition of the MEG signals was stopped less than 300ms after the last stimulus trigger was sent. Therefore, the last epoch cannot have the full [-100,200]ms time definition. This shorter epoch would prevent us from averaging all the trials easily. As we already have enough repetitions in this experiment (240), we can just ignore it. The total number of epochs is then 239.
Averaging
- Drag and drop all the Trigger01 trials to the Process1 tab.
Run the process Average > Average files: By trial group (folder average)
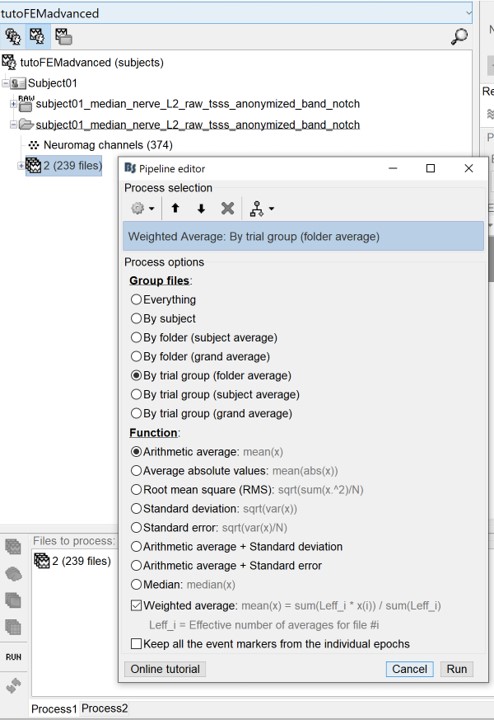
Review the average for the MEG and EEG as a topography plot: Right-click on the averaged signal > EEG > 2D disc, repeat for MEG.
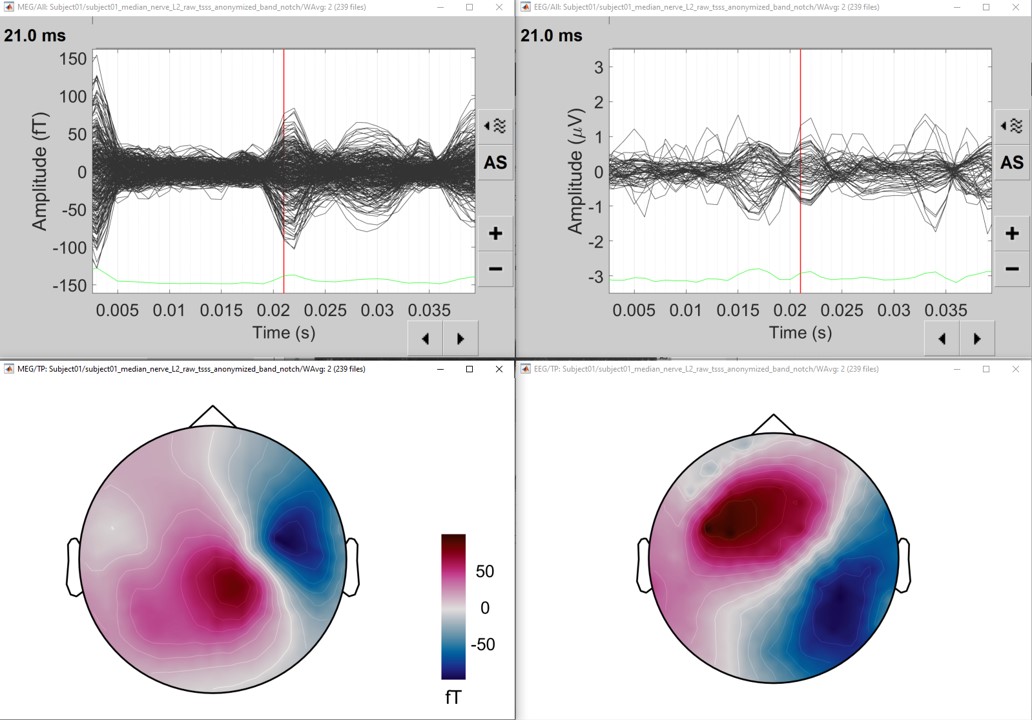
- At the selected time (21ms), an ERP is visible with a nice dipolar pattern on the sensors, both for the EEG and MEG.
Forward model
We are going to use the realistic FEM model previously generated from the MRI. Go to the "Anatomy" view, and make sure that the FEM head model is highlighted in green color (it should be the case if you have only one model). You may also highlight the cortex to use for the computation (select the cortex_15002V).
You can compute the forward model both for EEG and MEG simultaneously, however, using the high mesh resolution model we recommend to compute separately the head model for each modality (EEG and then MEG). The time required for EEG is around one hour for ~70 channels, for the MEG with 306 sensors it can take up to 4 hours or more (with the integrations points).
The EEG/MEG FEM computation depends on the computation of the FEM transfer matrix, which is related to the resolution of the FEM head mesh (number of vertices) and the number of sensors. In most of the case, the number of EEG sensors is lower than the number of MEG sensors. Furthermore, internally the MEG sensors modeling uses the integrations points, which increase the number of computation points (~ multiplied by 4 for the magnetometers and by 8 for the gradiometers). Therefore, the MEG requires more time than the EEG.
To reduce the MEG computation time, there are some tips:
Use only the inners tissues (wm, gm, and CSF) ==> reduce the number of vertices
Do not use the integration points ==> reduce the number of virtual sensors
- These parameters can be tuned from the DUNEuro options panel (see the advanced panel)
EEG with DTI tensors
- Go back to the "Functional data" view
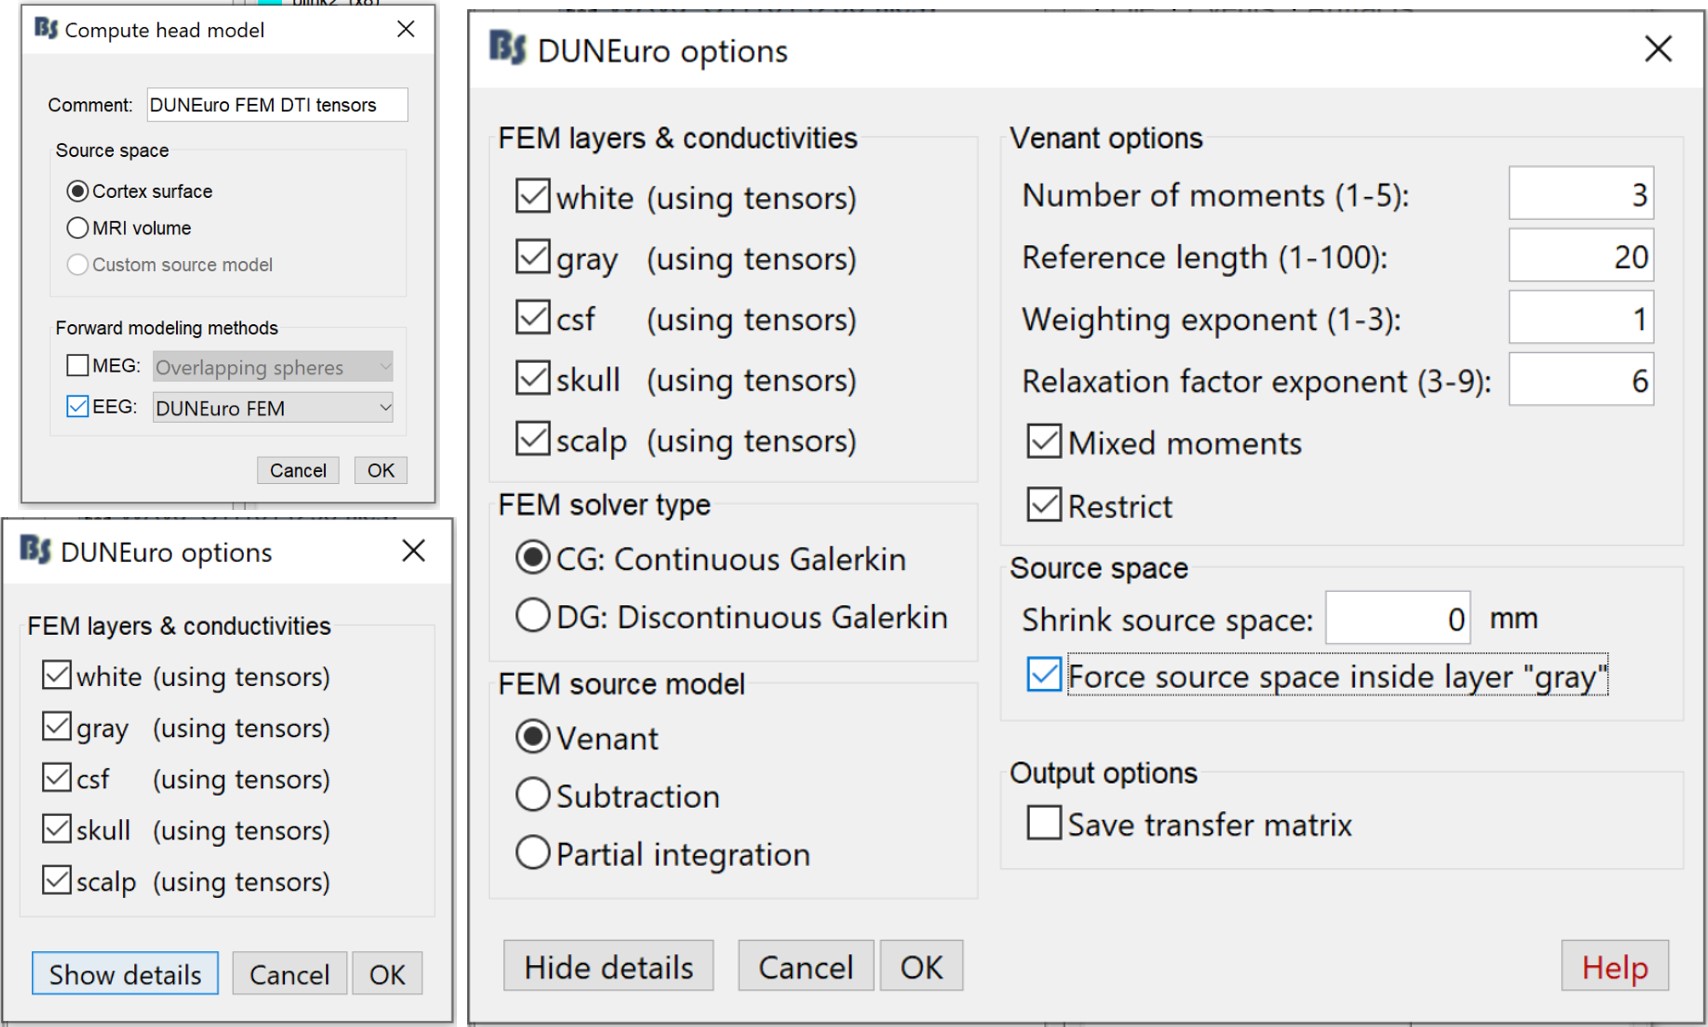
Right-click on the channel file (folder with imported epochs) > Compute head model
Select EEG only > DUNEuro FEM, and set the comment to "DUNEuro FEM EEG DTI tensors"
- On the DUNEuro options panel: click on "Show details" and set the options as illustrated below
Click OK. Depending on the performance of your computer, the FEM EEG head modeling can last between 30min to 3hrs. Once the computation is done, a new node with the name "DUNEuro FEM EEG DTI tensors" appears in the Brainstorm database navigator, which can be used for the source localization process.
MEG with DTI tensors
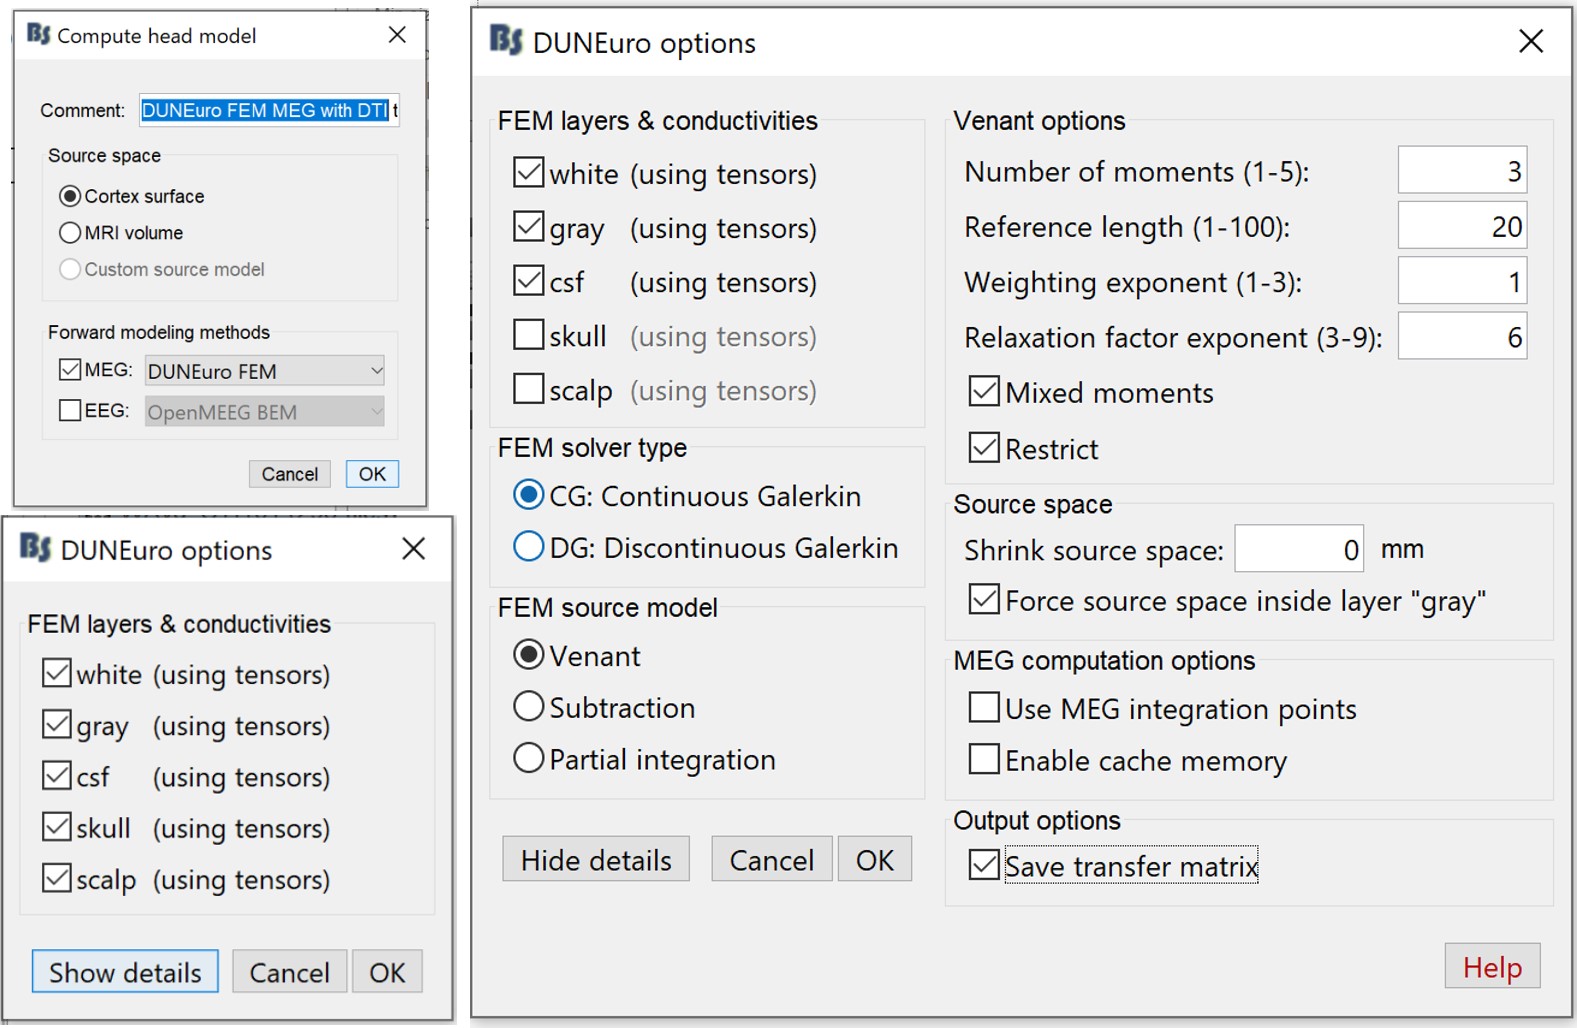
Right-click on the channel file > Compute head model
Select MEG only > DUNEuro FEM, and set the comment to "DUNEuro FEM MEG DTI tensors"
- On the DUNEuro options panel: click on "Show details" and set the options as illustrated below. To reduce the computation time, we select only the inner layers (white, gray and CSF).
Click OK. Depending on the performance of your computer, the FEM MEG head modeling can last between 1hr to 4hrs. Once the computation is done, a new node with the name "DUNEuro FEM MEG DTI tensors" appears in the Brainstorm database navigator, which can be used for the source localization process.
EEG with isotropic conductivity
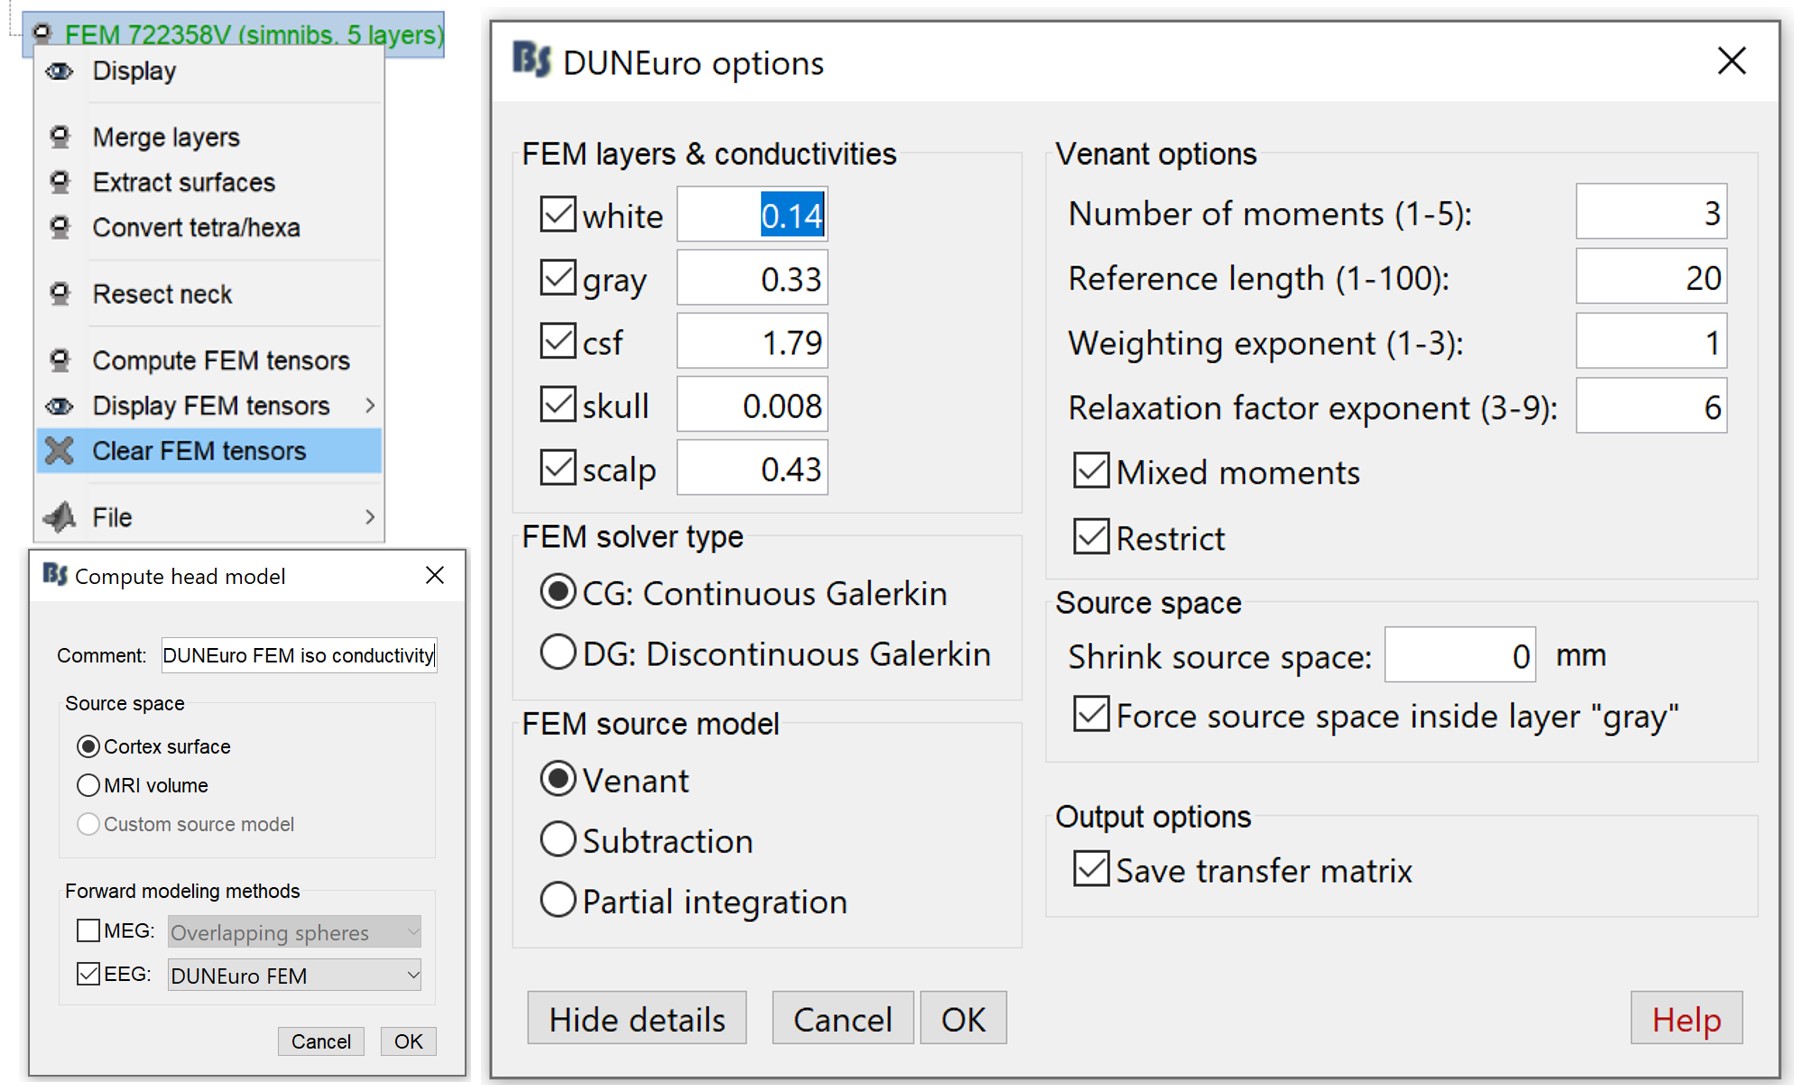
If the DTIs are not available, it is possible to use the isotropic conductivities instead. In this tutorial, we will compute another forward model in order to compare the sources obtained with anisotropic or isotropic conductivities.
First you need to make sure that the tensors are not computed. If you have the tensors already computed, you need to clear these values. Go to the "Anatomy" view, right-click on the FEM mesh > Clear FEM tensors.
Go back to "Functional data", right-click on channel file > Compute head model. In this case, you can change the isotropic conductivity for each tissue. Set the options as in the figure below.
MEG with isotropic conductivity
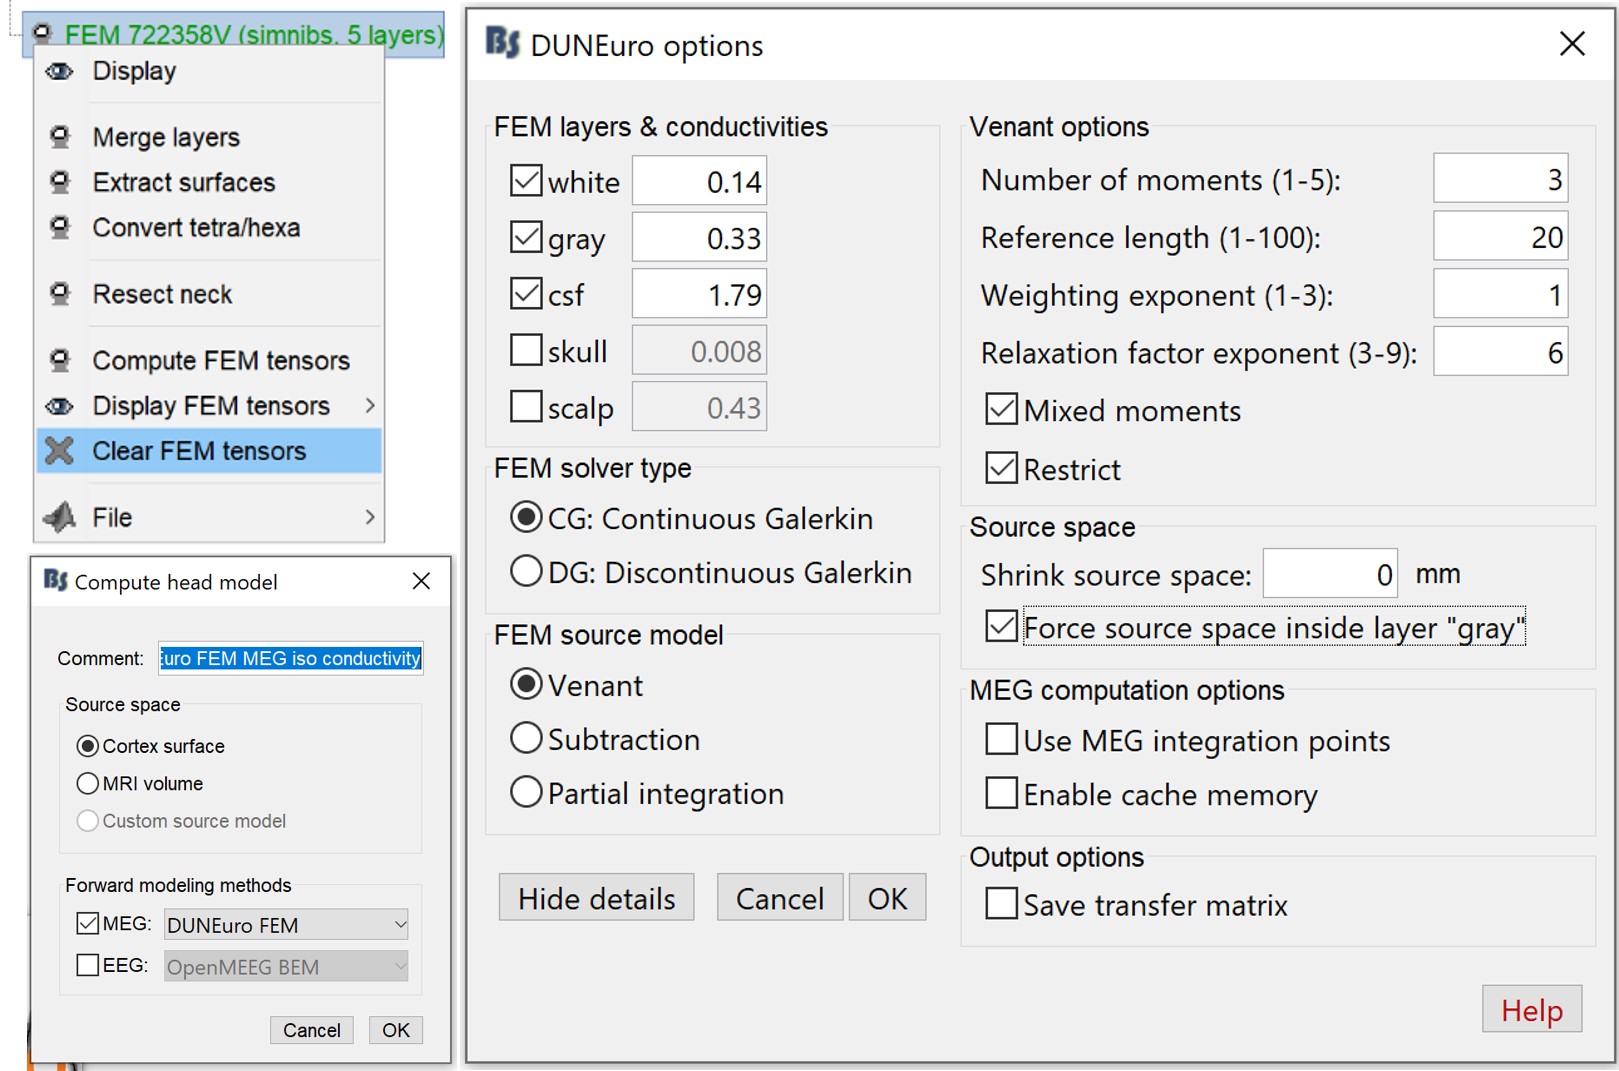
- Same as before, first you need to make sure that the tensors are not computed.
Right-click on the channel file > Compute head model, and set the value as in the figure below. In this example keep only the inner tissues (white, gray and CSF).
Source estimation
Noise covariance matrix
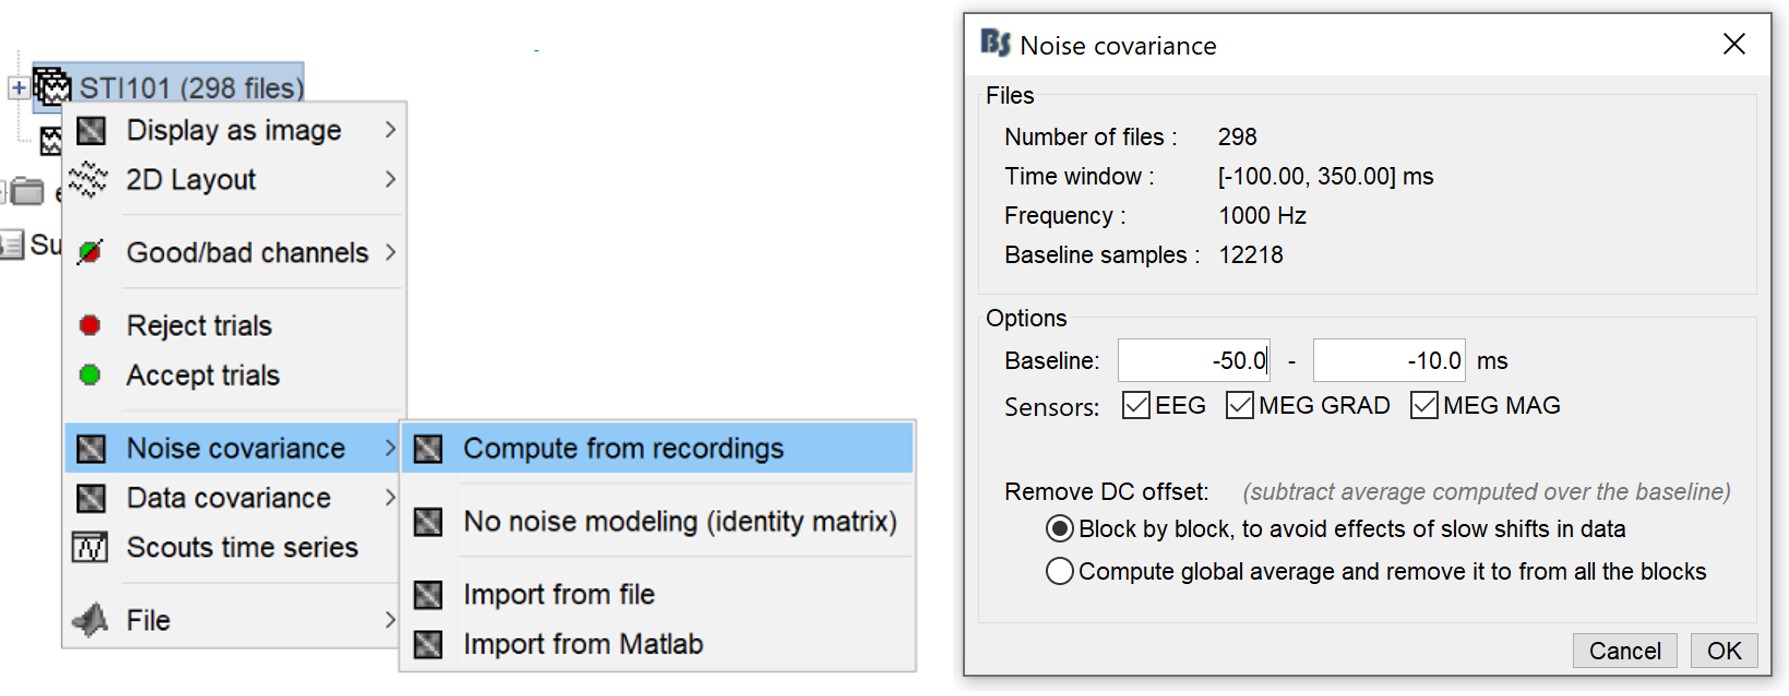
- We will use the baseline of the single epochs to calculate the noise covariance matrix.
Right-click on the epochs group > Noise covariance > Compute from recordings. Enter the same baseline interval we used for removing the DC offset: [-100, -10] ms
Inverse model
It is recommended to study separately the two modalities because Brainstorm does not offer any reliable method for combining MEG and EEG source imaging yet. More explanations in the Source estimation tutorial.
- Repeat the same step for each of the four forward models (EEG/MEG, DTI/isotropic):
Right-click on the head model > Compute sources > Dipole modeling.
Edit the comment to be able to identify the source maps easily: EEG FEM DTI, EEG FEM ISO, MEG FEM DTI, MEG FEM ISO.
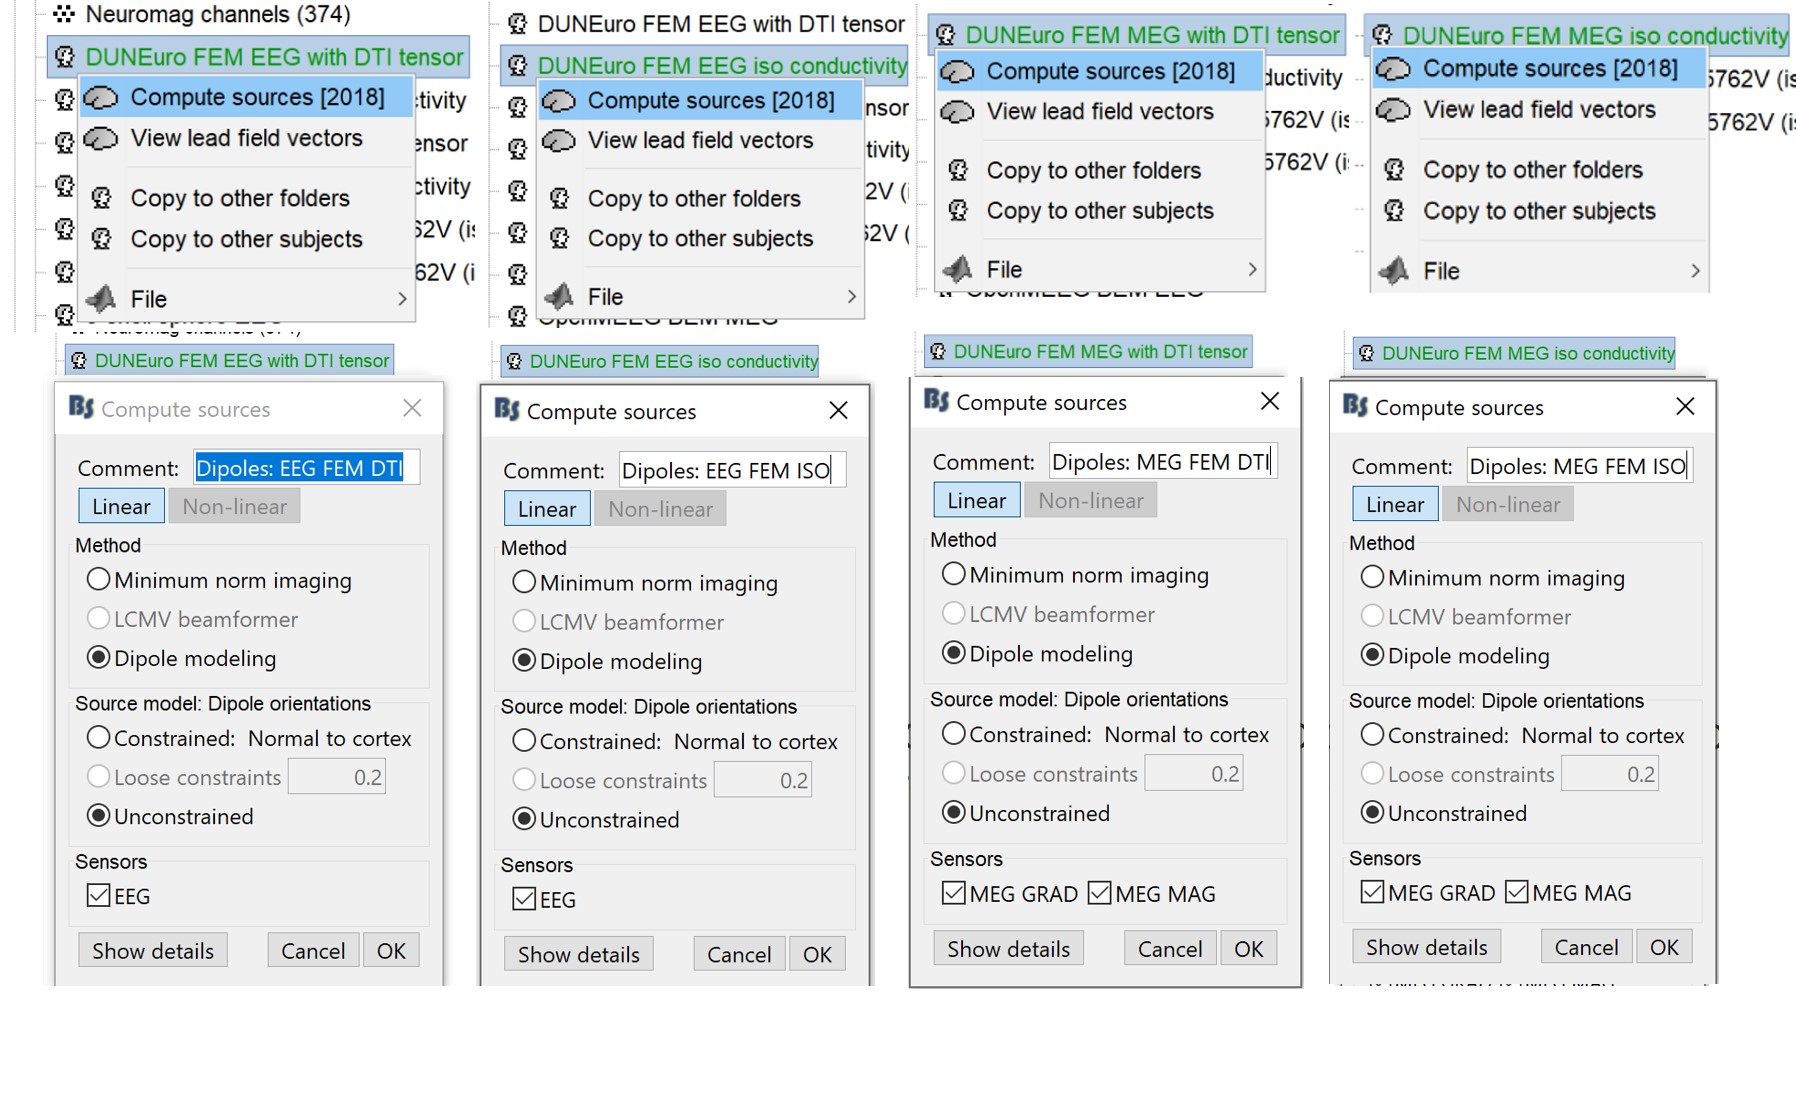
For each forward model, this operation creates a shared inversion kernel and one source link for each block of recordings in the folder.
![[ATTACH] [ATTACH]](/moin_static1911/brainstorm1/img/attach.png)
Dipole scanning
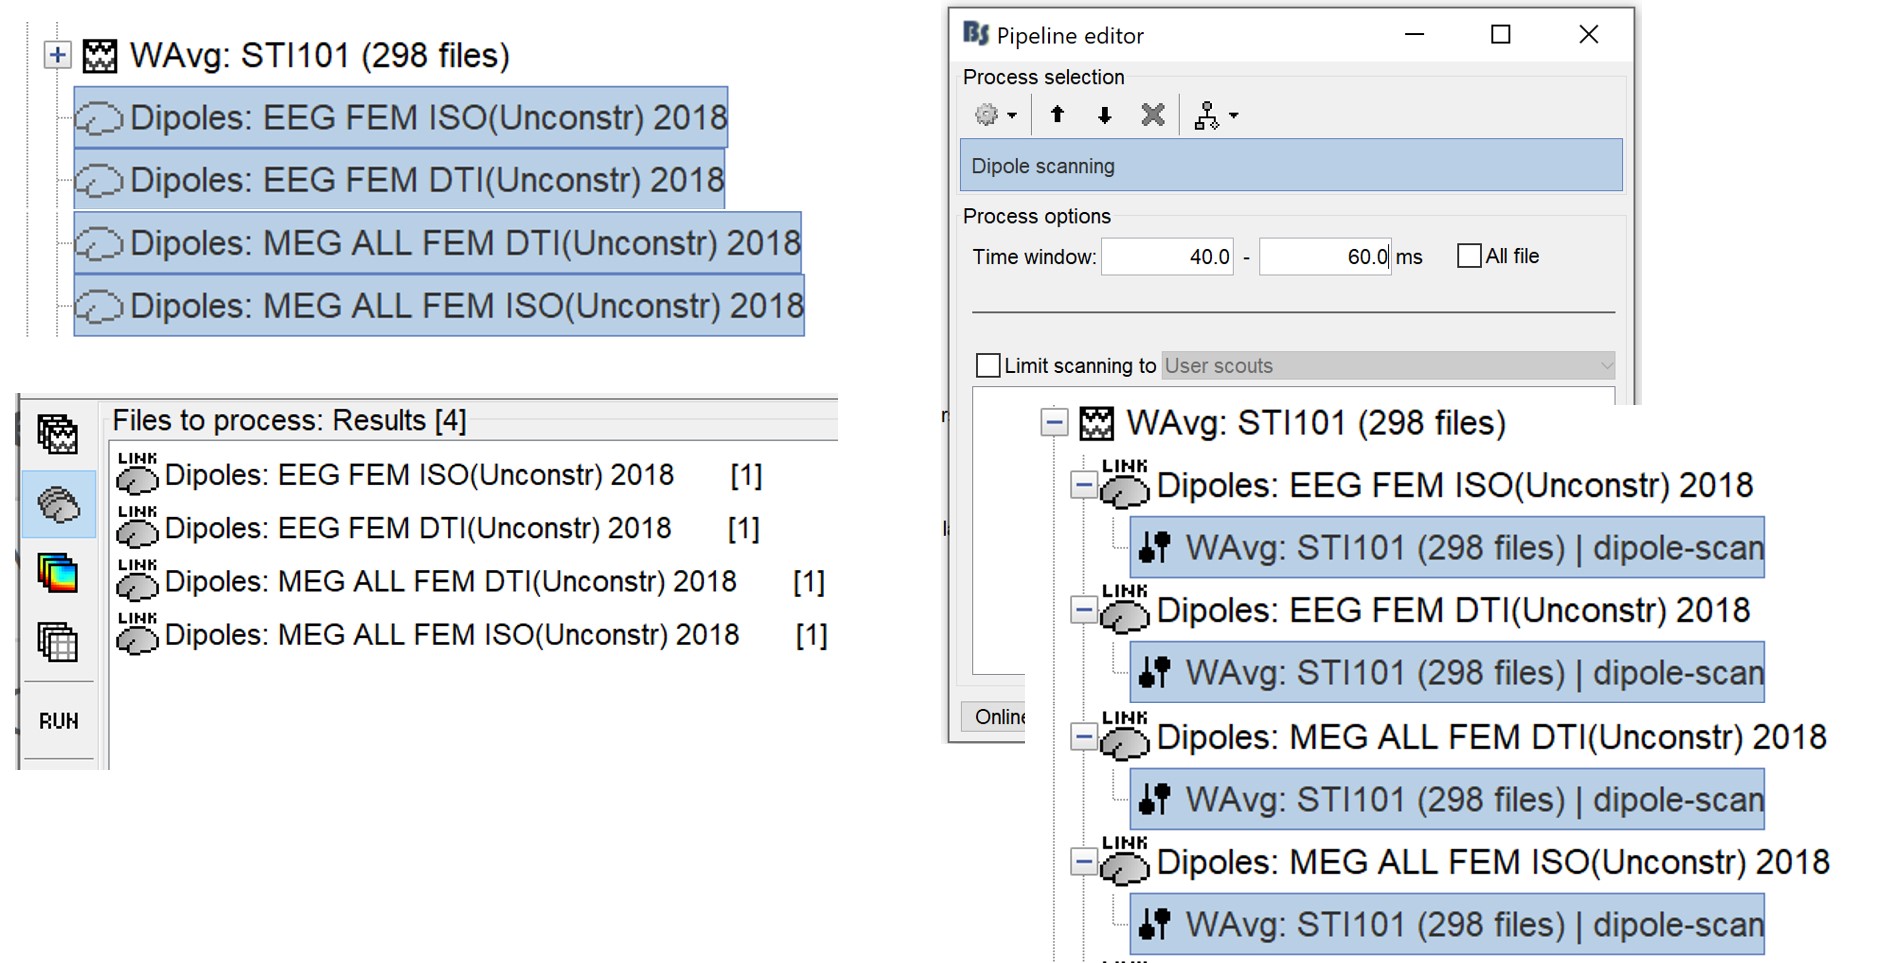
- Drag and drop the source links for the average in the Process1 tab.
Run the process: Sources > Dipole Scanning > 40ms-60ms. See the Dipole scanning tutorial.
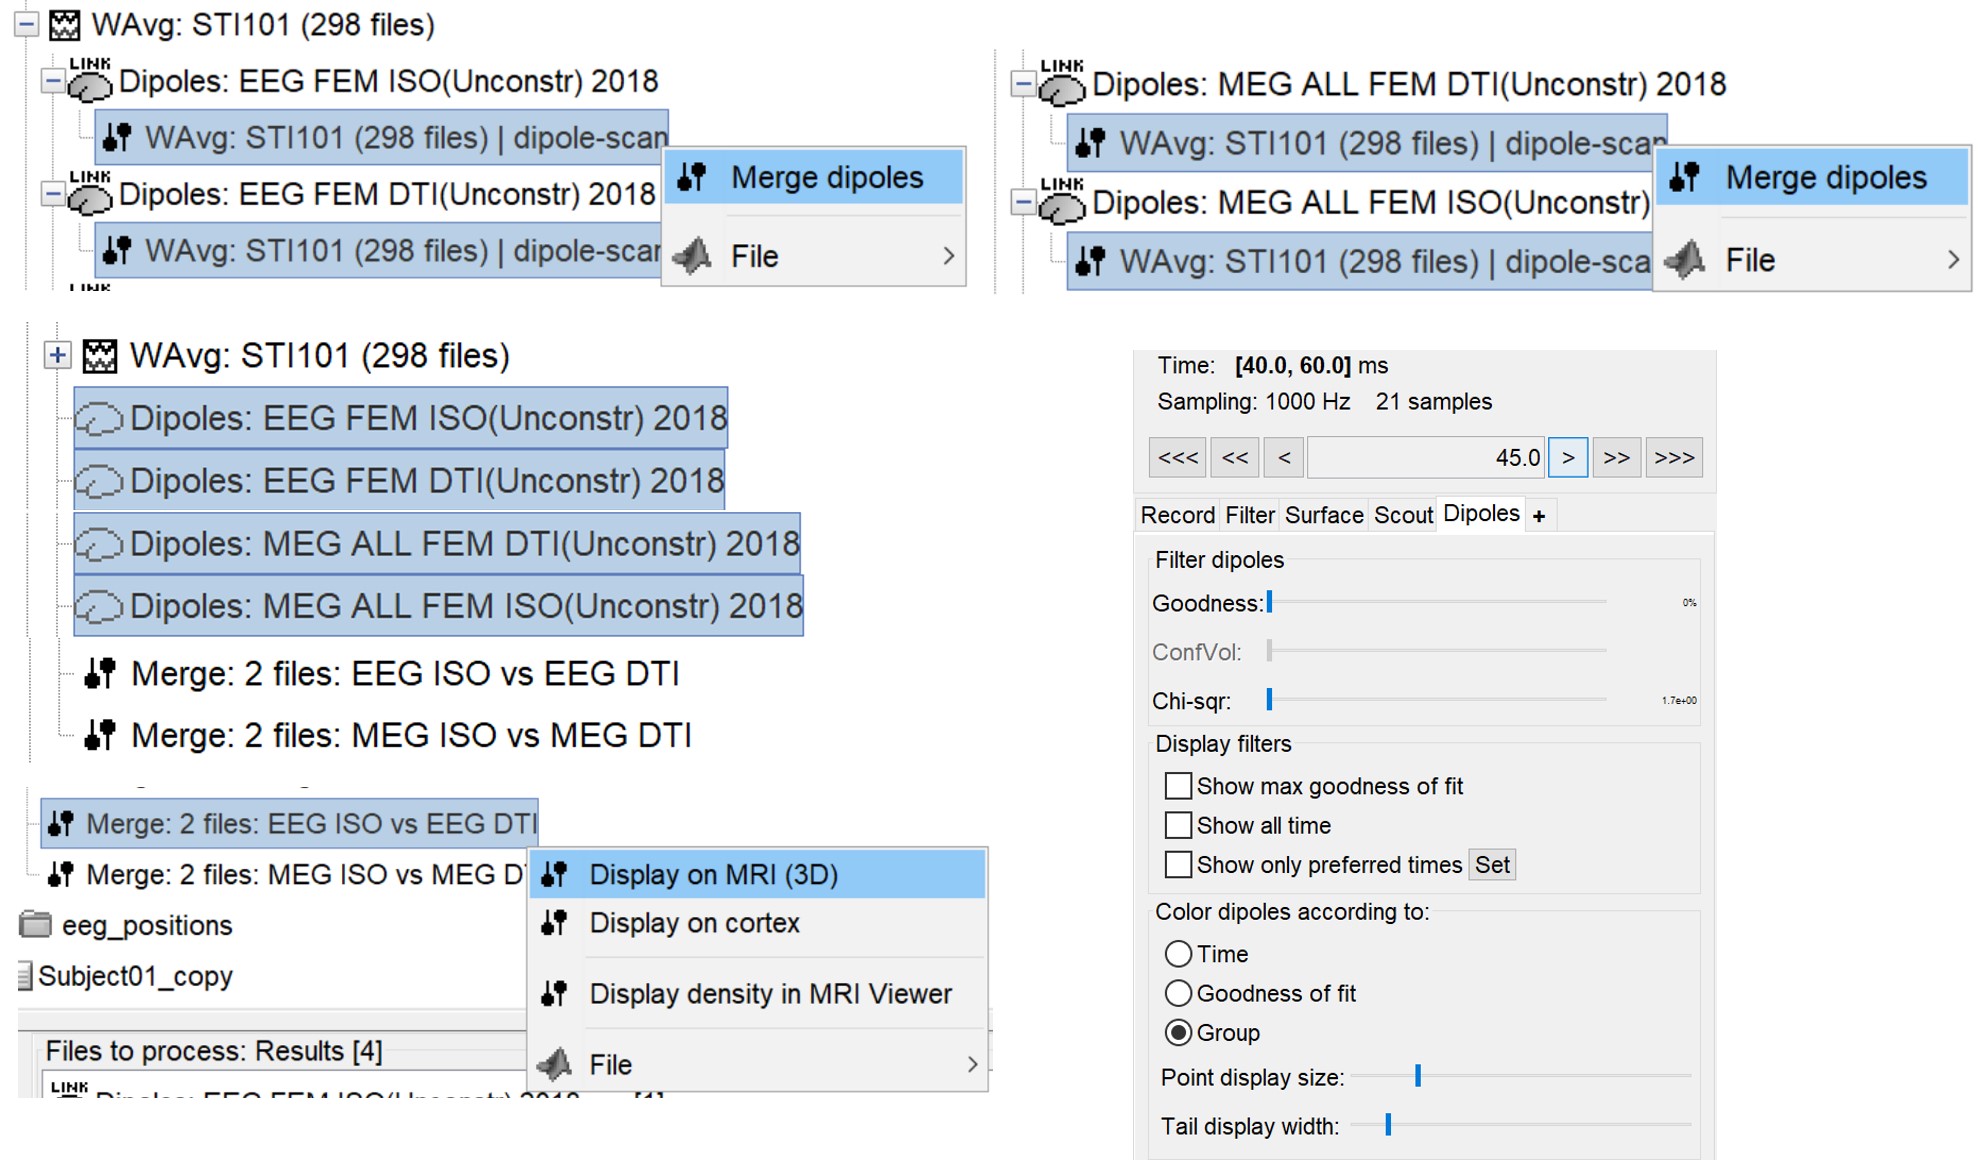
- Select and merge the MEG ISO and the MEG DTI dipoles. Repeat for the EEG dipoles.
Rename the merged dipoles with a clearer comment, as illustrated below.
Comparison: DTI vs isotropic
The following figures (left EEG, right MEG), show the localization of the dipoles on the MRI at the 21ms. The ISO model is colored in green whereas the DTI model is colored in red.
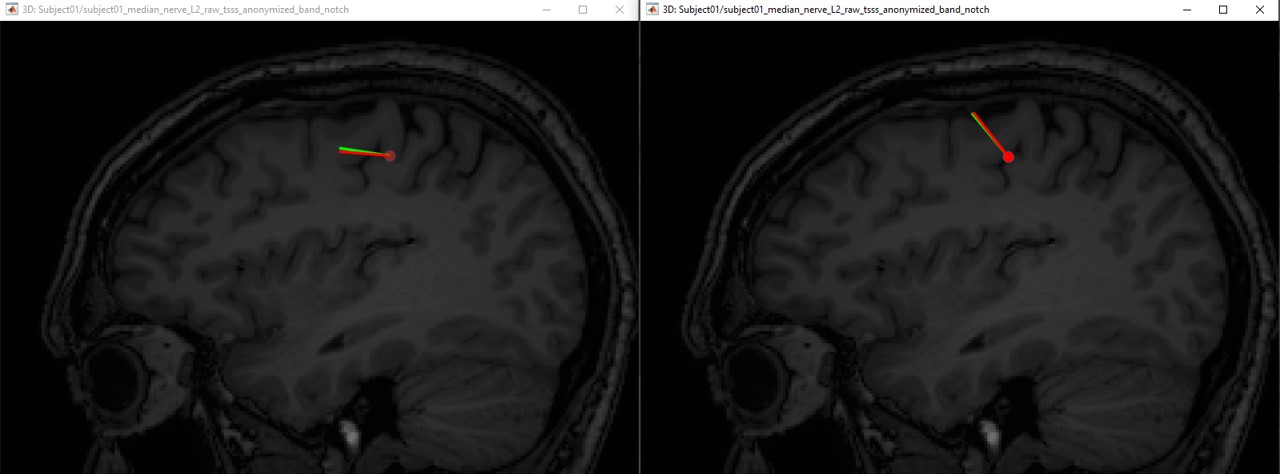
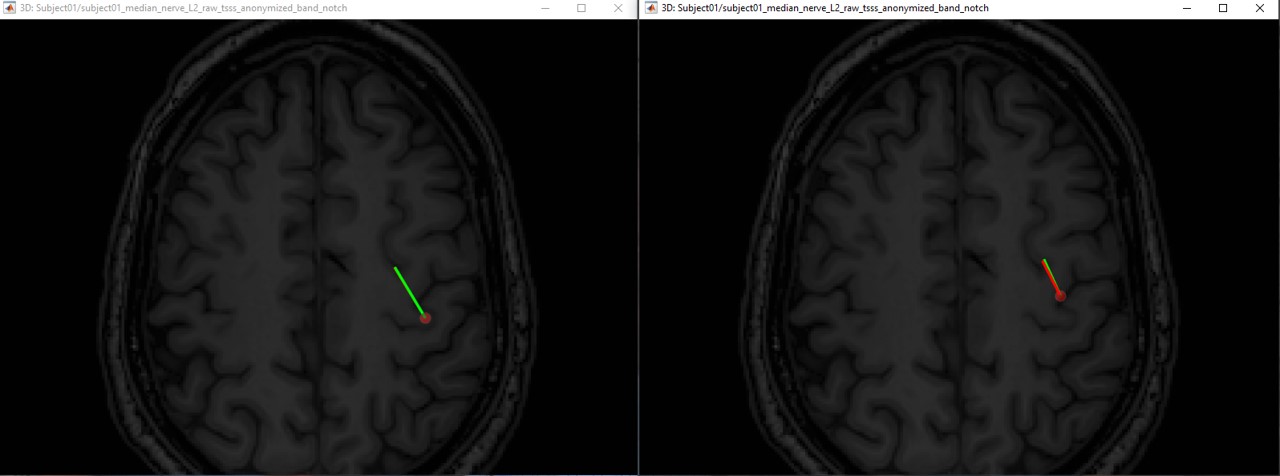
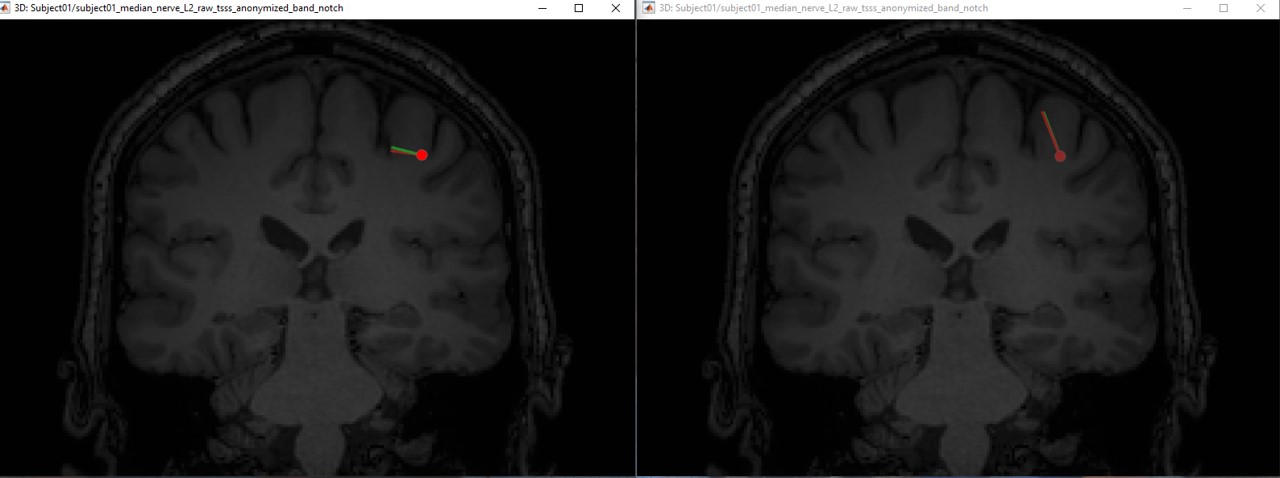
In this experiment, the anisotropy does not show a significant effect on the source localization, whereas it shows a slight difference in the orientation.
Comparison: MEG vs EEG
When we compare between the EEG and the MEG, there is a difference of 20mm between the localization between the MEG and the EEG as well as a difference in the orientation in the coronal view.
If we compare the difference between the EEG and MEG dipoles, the following figures (left anisotropy, right isotropic), show the localization of the dipoles on the MRI at the 21ms. The EEG dipole is colored in green whereas the MEG dipole is colored in red.


Aniso: Eeg [-7.5 -35.7 89.8] vs Meg [-0.2 -33.6 88.6] ==> distance = 7.7mm
Iso: Eeg [-7.5 -35.7 89.8] vs Meg [-0.2 -33.6 88.6] ==> distance = 7.7mm
In both modalities, the dipoles are located exactly in the same positions, and there is 7.7mm between the two dipoles. Furthermore, we notice a difference on the orientation on the coronal and sagittal views
Comparison: FEM vs BEM/OS
We will now compare qualitatively the FEM results with the default methods implemented in Brainstorm: Overlapping spheres for MEG, BEM for EEG.
Right-click on the channel file > Compute head model > MEG: Overlapping spheres
Right-click on the channel file > Compute head model > EEG: OpenMEEG BEM
Repeat the same source localization procedure: Compute sources and Dipole scanning.
In the following figures, left is the dipoles computed from the EEG (BEM in red and FEM in green), right are the dipoles computed from the MEG (OS in red and FEM in green)


EEG: fem [-7.5 -35.7 89.8] ; bem [-10.7 -35.0 89.5] ==> 3.3mm
MEG: fem [-0.2 -33.6 88.6] ; os [-10.7 -39.3 83.2] ==> 13.1 mm
As expected, the slight difference on the localization can be explained by the difference on the head shape, the conductivity values as well as the resolution method.
Additional documentation
Related tutorials
Articles
Medani T, Garcia-Prieto J, Tadel F, Schrader S, Joshi A, Engwer C, Wolters CH, Mosher JC, Leahy RM, Realistic head modeling of electromagnetic brain activity: An integrated Brainstorm pipeline from MRI data to the FEM solution (preprint), SPIE Medical Imaging, Feb 2021
Scripting
The following script from the Brainstorm distribution reproduces the analysis presented in this tutorial page: brainstorm3/toolbox/script/tutorial_fem.m

